Teachers and Students in Science, Technology, Engineering and Mathematics
Measurement Uncertainty
What is Measurement?
Measurement refers to a series of operations carried out to determine a value of a quantity.
What is the Measurand?
We have a special name for the quantity obtained by measurement. We call it the measurand. For example, if we use an electronic balance to measure the mass of a coin, the mass of the coin will be the measurand.
What is Measurement Uncertainty?
The result of a measurement consists of two parts: one is called the "measured value", and the other is called the "measurement uncertainty"
The "measured value" is not the true value because the true value is unknown and unknowable. It is only an estimate of the value of the measurand. Therefore, in order to be complete, the "measured value" should be accompanied by a statement of the uncertainty of that estimate.
The "measurement uncertainty" describes the dispersion of the "measured value" that could reasonably be attributed to the measurand. As in the coin example above, no matter how good the electronic balance is, we can only state an approximate mass for the coin since there are many factors in the measurement process that can affect the measured result, such as the ambient temperature, pressure, etc

How to Quantify the Dispersion of the Value?
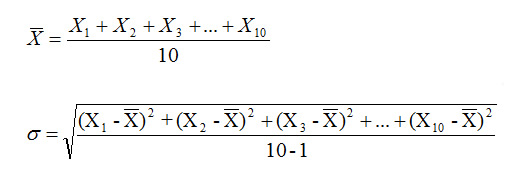
A common method in statistics to quantify the dispersion of a set of data is to calculate the Standard Deviation.
For example, consider a set of 10 numbers X1, X2, X3, X4, X5 … X10, the mean and standard deviation σ are obtained as follows.
How to Evaluate "Measurement Uncertainty"?
To understand how to evaluate measurement uncertainty, it is easier to illustrate with an example. The following is a simple example of evaluation of measurement uncertainty in battery voltage measurement.
 Measurement uncertainty in battery voltage measurement
Step 1 : Define the Measurand
The measurand Y is the voltage of a battery, which is measured by a voltmeter.
Step 2 : Identify the Input Quantities and Set up the Measurement Model
The input quantities that can affect the measured results are identified as follows:
- M denotes meter reading
- R denotes uncertainty due to display resolution of the meter
- A denotes correction to the meter reading
The mathematical relationship between the input quantities (M, R and A) and the measurand Y is called the Measurement Model. In this example it is given by the following equation.
Y = M + R + A
Step 3: Evaluation of Standard Uncertainty of Each Uncertainty Component
For each input quantity (also called uncertainty component), we need to evaluate its Standard uncertainty.
- Standard uncertainty - uncertainty of the result of a measurement expressed as a standard deviation.
There are two ways to evaluate the standard uncertainty of a component, type A and type B.
- Type A - Method of evaluation of uncertainty by the statistical analysis of series of observation. It is used on frequency distributions and can be characterized by standard deviations.
- Type B - Method of evaluation of uncertainty by means other than the statistical analysis of series of observation. It is used on a priori distributions based on experience or other information.
Step 3.1: Evaluation of Standard Uncertainty of meter reading M
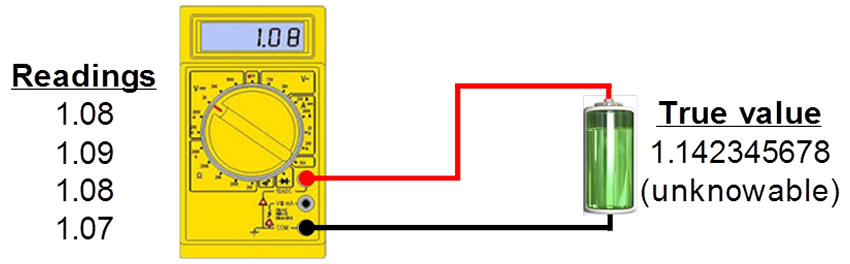
Four volt meter readings have been taken (1.08 V, 1.09 V, 1.08 V, 1.07 V). The individual readings differ in value because of random variations in the influence quantities or random effect (e.g. ambient temperature). Type A evaluation method therefore is used to estimate the uncertainty due to these effect.
The value of M is taken as the mean of the four meter readings = (1.08 V + 1.09 V + 1.08 V + 1.07 V)/4 = 1.08 V. The standard uncertainty of M is taken as the Experimental Standard Deviation of the Mean (ESDM) of the 4 readings and is derived as follows.
Experiment standard deviation σ of the 4 readings:
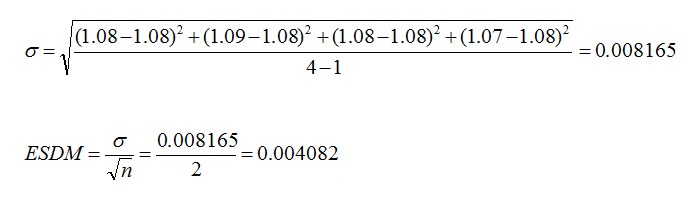
Hence the Standard Uncertainty for M is 0.004082 V
Step 3.2: Evaluation of Standard Uncertainty due to display resolution of the meter R
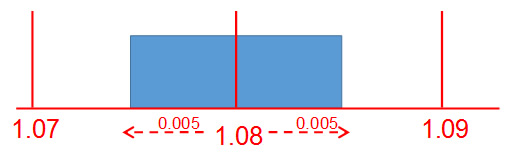
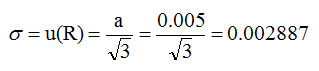
Type B evaluation method is used to estimate the standard uncertainty for R. The mean of R is zero. It is a rectangular distribution with semi-range α = 0.005 V. The standard deviation for a random variable with rectangular distribution of semi-range α is given by a divided by square root of 3. Hence
Standard uncertainty for R is
Step 3.3: Evaluation of correction to the meter reading A
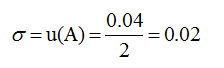
The value and standard uncertainty of A are given by the calibration certificate of the value meter. Suppose the calibration certificate states that the correction of the meter is +0.06 V with expanded measurement uncertainty of 0.04 V and coverage factor k = 2.
The Type B evaluation of standard uncertainty for A will be
Step 4: Derive the Combined Standard Uncertainty
Combined standard uncertainty - standard uncertainty of the result of a measurement when that result is obtained from the values of a number of other quantities, equal to the positive square root of a sum of terms, the terms being the variances or covariances of these other quantities weighted according to how the measurement result varies with changes in these quantities.
After obtaining the standard uncertainty of all components, we can derived the Combined Standard Uncertainty of the Measurand by using the Law of Propagation of Uncertainty (LPU) given below
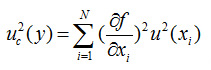
where  is the sensitivity coefficients
For this example, the sensitivity coefficients are
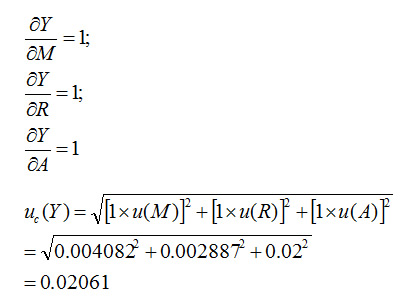
The derivation can be summarized in the following table.
| Uncertainty Component | Input quantity | Standard Uncertainty | Distribution |
|---|---|---|---|
| M | 1.08 | 0.004082 | 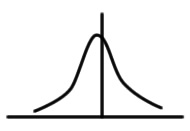 |
| R | 0 | 0.002887 | 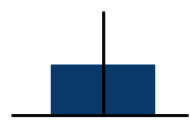 |
| A | 0.06 | 0.02 | 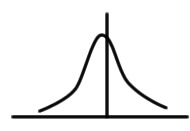 |
| Y | 1.14 | 0.02061 |  |
Step 5) Evaluation of expanded uncertainty
- Expanded measurement uncertainty U - quantity defining an interval about the result of a measurement that may be expected to encompass a large fraction of the distribution of values that could reasonably be attributed to the measured.
- Coverage factor k - used as a multiplier of the combined standard uncertainty in order to obtain an expanded measurement uncertainty.
The expanded uncertainty U, with its coverage factor k, corresponds to an approximate 95 % probability that the value of the measurand Y lies within the interval y-U to y+U. It is given by the following equation.
U = k×uc(Y)
The value of k depends on the probability distribution of the measurand. In Annex G of GUM it was proposed that if the assumptions of the central limit theorem are not violated, the measurand may be treated as student-t distributed with an effective degrees of freedom Veff obtained from the Welch-Satterthwaite formula given below:
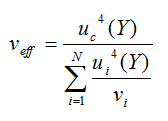
In this example, 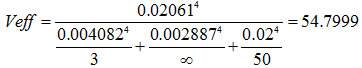 . From the student-t distribution, an effective degrees of freedom of 54.8 corresponds to a coverage factor of around 2.0049. Hence the expanded uncertainty = 2.0049 × 0.02061 = 0.04132 ≈ 0.041
SCL Measurement Uncertainty Software Tool
The Standards and Calibration Laboratory (SCL) has developed two software tools namely (i) SCL Tool and (ii) SCL Simulator for uncertainty evaluation. The SCL Tool applies the law of propagation of uncertainty for the evaluation of measurement models in accordance with the Guide to the Expression of Uncertainty in Measurement (JCGM 100:2008) (also known as the GUM uncertainty framework). The SCL simulator implements the propagation of the distributions based on a Monte Carlo method (MCM) in accordance with Evaluation of measurement data — Supplement 1 to the ‘Guide to the expression of uncertainty in measurement’ — Propagation of distributions using a Monte Carlo method (JCGM 101:2008). Both software tools were written in Visual Basic for Application (VBA) programming language which is tightly integration with Microsoft Excel. The user can input the measurement model and the input quantities easily with the Excel worksheet.
SCL Tool
The user can encode the measurement model and input the relevant parameters of the uncertainty components (i.e. the values, the standard uncertainties and the degrees of freedom) in table form on a Microsoft Excel worksheet. The tool will automatically calculate the sensitivity coefficients and obtain the following output values through the following five Excel user-defined functions (UDF):
- the measurand (UDF: gum_result() )
- the combined standard uncertainty (UDF: gum_csu() )
- the effective degrees of freedom (UDF: gum_edof() )
- the coverage factor (UDF: gum_k() )
- the expanded uncertainty (UDF: gum_eu() )
For details of the SCL tool for evaluation of uncertainties, please refer to the examples of measurement models encoded in this tool.
SCL Tool (Web Version)
Disclaimer
The Standards and Calibration Laboratory of the Government of the Hong Kong Special Administrative Region of the People’s Republic of China (“Government”) provides this software tool on an “as is” basis for educational purpose and general information only. Whilst the Government endeavours to ensure the accuracy of information contained in this software tool, no statement, representation, guarantee, warranty of any kind, whether express or implied, is given by the Government as to the accuracy, availability, completeness, reliability, fitness for a particular or any purpose, security, timeliness, title, non-infringement, appropriateness or usefulness of the information contained herein and in so far as permitted by the laws of the Hong Kong Special Administrative Region. The Government shall not have any legal liability, obligation or responsibility (including but not limited to liability for negligence) for any loss, destruction, damages, injury or death (save and to the extent any such injury or death is caused by the negligence of the Government or any of its employees in the course of employment) howsoever arising out of or in connection with any use or misuse of or reliance on the information contained this software tool.
SCL Simulator
The user can specify the relevant parameters of the uncertainty components (also called input quantities), such as the estimates, the standard uncertainties and the probability distribution function (PDF) in table form. The SCL simulator supports the following features for setting up the MCM simulation models:
- Up to 8 types of PDF assignment for the input quantities;
- Multivariate Gaussian distribution for correlated input quantities;
- Selection of number of MCM trials by fixed sample size or by adaptive mode ; and
- Selection of symmetric or shortest coverage interval for uncertainty evaluation.
The MCM simulation results will be reported in the same Excel worksheet. In adaptive simulation mode, the SCL simulator will automatically check the validity of the GUF according to the procedures specified in Supplement 1.
For details of the SCL simulator, please refer to the Software Manual and the examples of measurement models encoded in this simulator.
SCL Simulator Software package
For enquiry of this software tool, please send email to : hslam@itc.gov.hk.
Disclaimer:
- The Standards and Calibration Laboratory of the Government of the Hong Kong Special Administrative Region of the People’s Republic of China (“Government”) provides the information on this website on an “as is” basis for educational purpose and general information only. Whilst the Government endeavours to ensure the accuracy of information contained herein, no statement, representation, guarantee, warranty of any kind, whether express or implied, is given by the Government as to the accuracy, availability, completeness, reliability, fitness for a particular or any purpose, security, timeliness, title, non-infringement, appropriateness or usefulness of the information contained herein and in so far as permitted by the laws of the Hong Kong Special Administrative Region. The Government shall not have any legal liability, obligation or responsibility (including but not limited to liability for negligence) for any loss, destruction, damages, injury or death (save and to the extent any such injury or death is caused by the negligence of the Government or any of its employees in the course of employment) howsoever arising out of or in connection with any use or misuse of or reliance on the information or inability to use such information.
- The Government does not warrant or represent that any information transmitted from this website is free of computer viruses. You are advised to perform virus scanning before using the software tool or any information from this website. The Government shall not be held liable for any loss, destruction or damage howsoever arising out of or in relation to any transmission from this website over the Internet.
- The Government reserves the right to omit, delete, suspend or edit, all information compiled by the Government in this website at any time in its absolute discretion without giving any reason or prior notice. Users are responsible for making their own assessment of all information contained in this website and are advised to verify such information by making reference, for example, to original publications and obtaining independent advice before acting upon it.
Interpreting Measurement Uncertainty in SCL's certificates
Example: Calibration of a voltmeter at nominal DC voltage 10.000 V
| Voltmeter | Measured Correction | |||
|---|---|---|---|---|
| Range | Meter Reading | Value y | Measurement Uncertainty | |
| Expanded Measurement Uncertainty U | Coverage Factor k | |||
| 10 V | 9.900 V | +100 mV | 1 mV | 2.0 |
As shown in the SCL certificate, at meter reading of 9.900 V, the measured correction y has a value of +100 mV and the expanded measurement uncertainty U is 1 mV. This means that there is an approximate 95% probability that the value of the correction y lies within the interval from 99 mV to 101 mV. When the meter reads 9.900 V, the actual voltage measured by the meter will lie between 9.999 V to 10.001 V with a level of confidence of approximately 95%.
 Calibration of a voltmeter at DC voltage 10.000 V example
Reference
- Evaluation of Measurement Date – Guide to the Expression of Uncertainty in Measurement, JCGM 100:2008.
- Evaluation of measurement data – An introduction to the "Guide to the expression of uncertainty in measurement" and related documents, JCGM 104:2009
- International Vocabulary of Metrology – Basic and General Concepts and Associated Terms (VIM 3rd edition), JCGM 200:2012