Teachers and Students in Science, Technology, Engineering and Mathematics
Metrology Around Us
Mass
The story of the gravitational acceleration at Hong Kong, the equator and the poles
Raymond WM Leung, Henry KL Chiu
Mass and Force Laboratory
Standards and Calibration Laboratory
A. Newton’s law of universal gravitation, the big G and the little g
If you have studied physics, you should know that Isaac Newton proposed that the motion of the planets and the moon as well as that of a falling apple were governed by his law of universal gravitation. This law says that two objects attract each other with a force equals to the product of their masses divided by the square of the distance between them and multiplied by the gravitational constant G. The equation can be written as (1)
 (1)
(1)
This gravitational constant G is often called the “Big G”. It has a small value of about 6.674 3 x 10-11 m3 kg-1 s-2 which indicates that the gravitational force is much weaker than the electromagnetic force. Looking at a souvenir magnet attached to a refrigerator, have you ever wonder that the gravitational force exerted by the entire mass of the earth is smaller than the magnetic force acted by the magnet on the door of the refrigerator?
It is easy to mix up the “Big G” with the “Little g” which is the acceleration of a body caused by the force acting on it due to the earth’s gravitational field. According to Newton’s second law of motion, this force can be written as mg as shown in (2), where m is the mass of the body.
 (2)
(2)
B. Why the acceleration of gravity is important in metrology
Before the twentieth century, the main purpose of conducting gravity measurements was to gain knowledge about the shape of the earth and the distribution of mass near the Earth’s surface. Later, the measurements of gravity became important not only to the geodesists, but also to metrologists in the measurement fields of force, torque and pressure which rely on applying force due to the earth’s gravity on a known mass, in air.
B.1 Generation of known force
For calibration of force measuring devices such as load cells, deadweight type force machine is the most accurate measuring instrument. The newton (N) is the SI unit of force. The force F generated by the force machine is given by the following equation.
 (3)
(3)
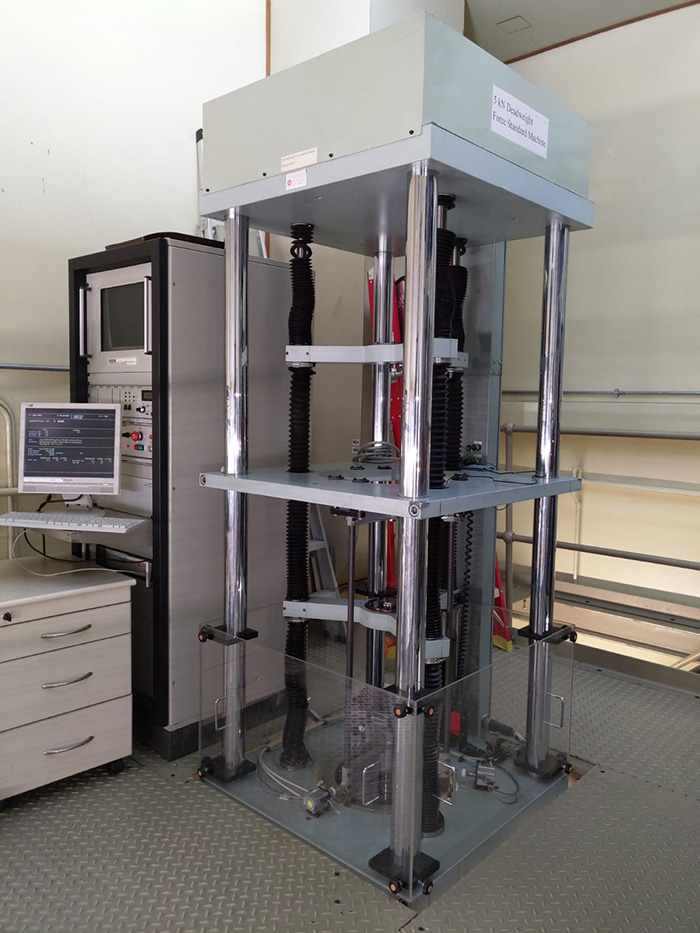
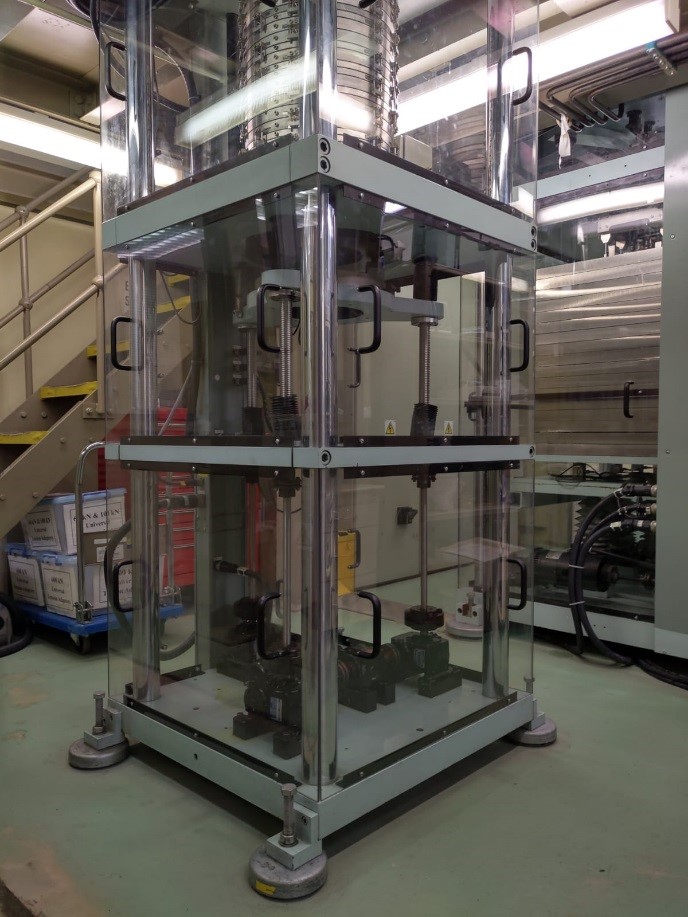
where m is the mass of the applied deadweights, g is the acceleration due to gravity, ρm and ρa are the densities of deadweights and ambient air respectively. The air density ρa can be easily determined by using an approximation formula expressed as a function of the atmospheric pressure, temperature and humidity [1][2].
B.2 Generation of known torque
Similar to force measurement, deadweight type torque machine is the most accurate instrument for calibrating torque measuring devices such as torque sensors.
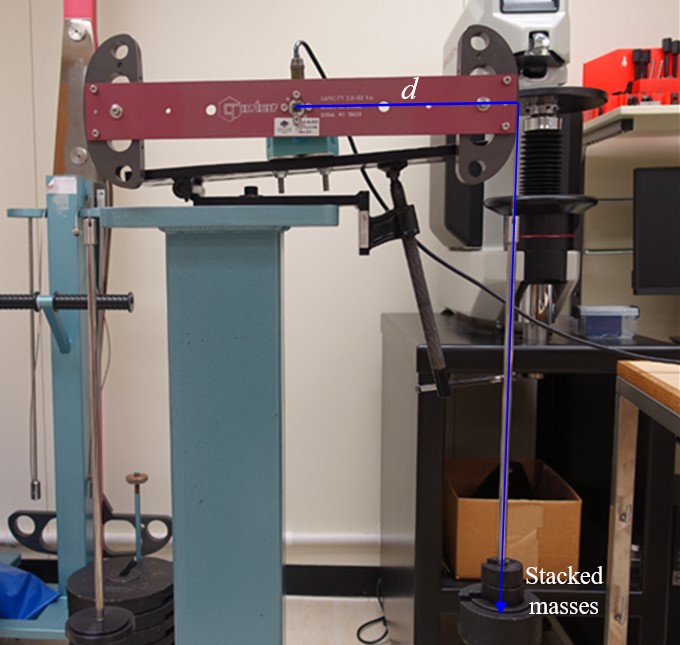 Fig. 2 Deadweight type torque machine at the Standards and Calibration Laboratory
The newton-metre (N.m) is the SI unit of torque. The torque T generated by the torque machine is given by the equation below.
 (4)
(4)
where m is the mass of the applied deadweight, g is the acceleration due to gravity, the deadweights are being applied at an orthogonal displacement d from the torque axis.
B.3 Generation of known pressure
The pressure balance, with either air or oil as working medium, is a common standard for pressure measurements. The pressure is generated by applying weights of known mass values onto a precision piston-cylinder assembly of known effective area.
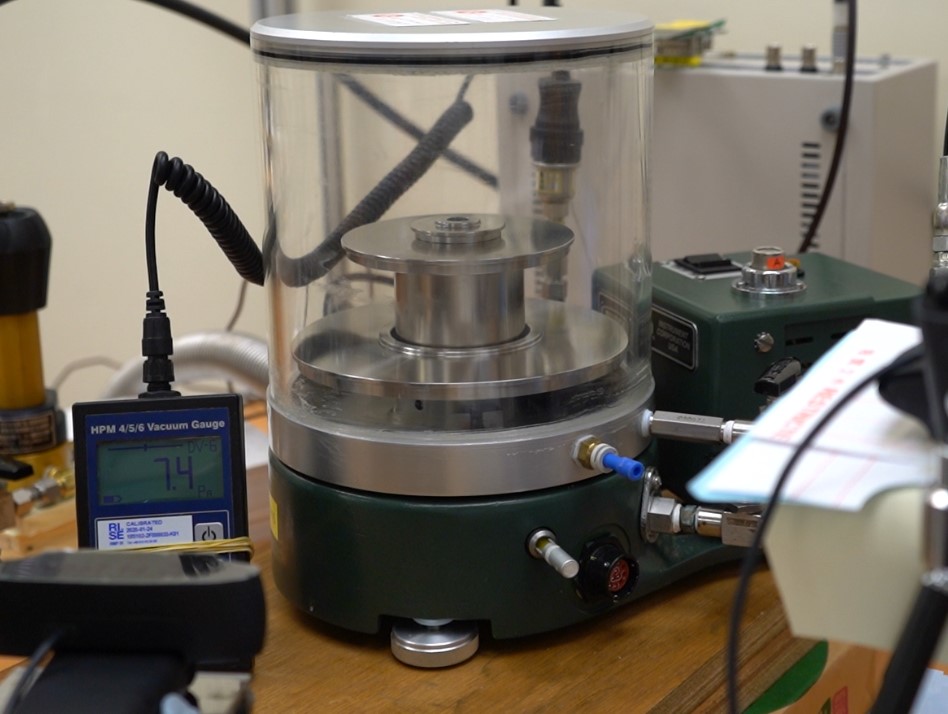
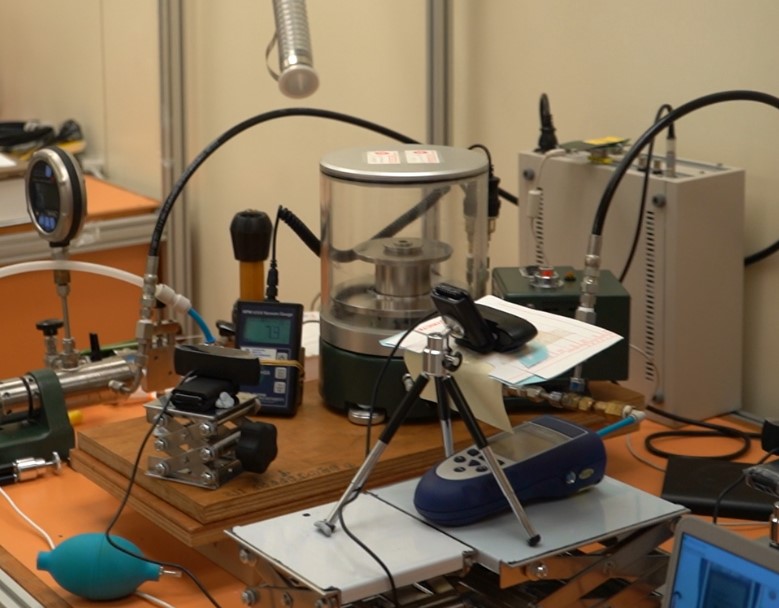
The pressure P generated is expressed by the following equation:
 (5)
(5)
where m is the mass of the load on the piston cylinder assembly, g is the acceleration due to gravity, ρa and ρm are the densities of the ambient air and the load respectively, A0 is the conventional area at zero pressure, a is the effective area distortion coefficient of the piston cylinder assembly, Pn is the nominal pressure equal to mg/A0, αp and αc are the linear coefficients of thermal expansion, per ℃, of the materials of the piston and cylinder respectively and t is piston temperature.
C. Estimating the value of g with physics
C.1. What elementary physics tells us about g
It might seem straightforward to apply equations (1) and (2) to calculate the value of g on the surface of the earth. Using an apple as an example, let m1 equals to the mass of the Earth M ≈ 5.972 19 x 1024 kg, m2 be the mass of the apple, and r be the distance between the apple and the center of the earth, we have then,
 (6)
(6)
The earth is not a perfect sphere but an oblate spheroid. The value of r is larger at the equator than at the poles. Scientists in the geodesy field usually represent the shape of earth by an ellipsoid. A widely adopted ellipsoid for the earth is the WGS-84. While we will not go into the details of WGS-84, let’s use the WGS-84 data and apply equation (6) to see what are the values of g at the equator, the poles and the Force Laboratory of the Standards and Calibration Laboratory (SCL) of Hong Kong. The results are listed in Table 1.
Are these estimates accurate?
| Location | North Pole | Equator | Hong Kong (Force Laboratory) |
|---|---|---|---|
| latitude, λ (degree) | 90 | 0 | 22.314 84 |
| distance from center of earth, WGS-84 ellipsoid (m) | 6 356 752.314 | 6 378 137 | 6 375 076 |
g given by  |
9.864 36 | 9.798 32 | 9.807 73 |

C.2. The International Gravity Formula (IGF)
For people working in the geodesy field, a common method to obtain the theoretical gravity at a location with latitude λ is to apply the International Gravity Formula (IGF). The following form of IGF is given by Aziz (2010) [3]. The IGF is known to give good estimates of g at different places on earth.
 (7)
(7)
We apply the IGF to obtain g at the equator, the poles and the Force Laboratory. The results are listed in Table 2. There are large differences between the results in Table 1 and 2. At the poles, the difference is 0.33%. What are the reasons for the difference?
| Location | North Pole | Equator | Hong Kong (Force Laboratory) |
|---|---|---|---|
| latitude, λ (degree) | 90 | 0 | 22.314 84 |
| g given by the IGF | 9.832 19 | 9.780 33 | 9.787 78 |
C.3. Other factors that affect the value of g
In deriving equation (6), some assumptions were made. Firstly, the rotation of the earth was ignored. Secondly, the two masses were assumed to be point masses. Let’s see how these factors affect the value of g.
C.4. Effect of the earth’s rotation on g
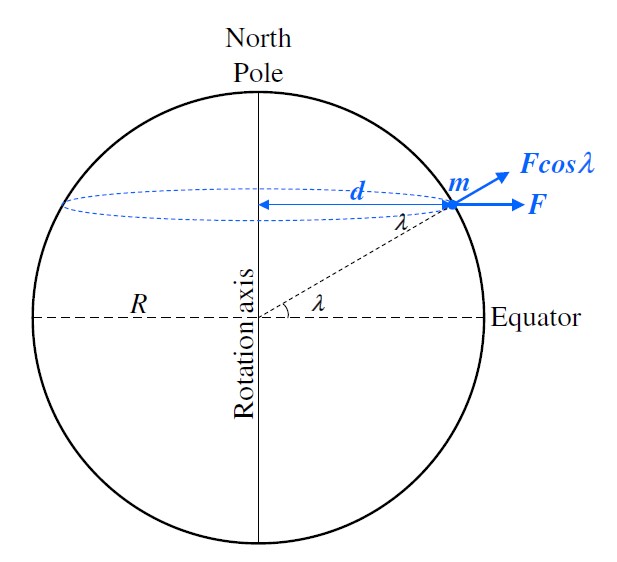
The rotation of the Earth creates a centrifugal force on an object. The magnitude of the force depends on the mass of the object m, the square of the angular velocity ω and the distance from the rotating axis d.
 (8)
(8)
For an object at latitude λ, d = r cos λ where r is the distance from the center of the earth. The direction of F is outward and perpendicular to the rotational axis. The component of F opposite to gravity is given by F cos λ. Therefore, the gravitational force will be reduced by a factor of F cos λ, or mrω2cos2λ due to earth’s rotation. The corresponding reduction in g is rω2cos2λ. The value of ω for earth is 7.292 115 x 10-5 rad s-1.
Let’s apply this correction to the results of Table 1 to obtain Table 3. We can see that the earth’s rotation alone is not sufficient to explain the differences between the results of Table 1 and 2.
| Location | North Pole | Equator | Hong Kong (Force Laboratory) |
|---|---|---|---|
| latitude, λ (degree) | 90 | 0 | 22.314 84 |
| distance from center of earth, WGS-84 ellipsoid (m) | 6 356 752.314 | 6 378 137 | 6 375 076 |
(A) g given by  |
9.864 36 | 9.798 32 | 9.807 73 |
| (B) rω2cos2λ. (correction due to centrifugal acceleration from earth’s rotation) |
0.000 00 | -0.033 92 | -0.029 01 |
| (A) + (B) | 9.864 36 | 9.764 41 | 9.778 72 |
C.5 Effect of the earth’s non-spherical form
Strictly speaking, equation (1) applies only to two point masses. The mass of the earth does not concentrate in a single point at the centre. Equation (6) is therefore only an approximation.
If the mass of a body is distributed in a volume, then the gravitational field at point P due to the body is obtained by summing the effect of all the mass in the volume using (1). The summing process involves application of advanced calculus to solve the Laplace and Poisson Equations which we will consider briefly in the separate “Additional Note” section. Only the result is mentioned here. Since the earth is not a perfect sphere, the gravitation field will have an additional term that depend on the latitude λ. This term is sometimes called the quadrupole moment of the earth’s gravitation field and its effect on g is given below.
 (9)
(9)
where J2 is a measure of ellipticity of the earth, M is the mass of earth and a the equatorial radius. One common value for J2 used in geodetic reference system is 1.08263 x 10⁻³. Let’s add the quadrupole moment term to the results of Table 3 to obtain Table 4. We can see that the results now agree well with that of the IGF.
| Location | North Pole | Equator | Hong Kong (Force Laboratory) |
|---|---|---|---|
| latitude, λ (degree) | 90 | 0 | 22.314 84 |
| distance from center of earth, WGS-84 ellipsoid (m) | 6 356 752.314 | 6 378 137 | 6 375 076 |
(A) g given by  |
9.864 36 | 9.798 32 | 9.807 73 |
| (B) correction due to centrifugal acceleration from earth’s rotation | 0.000 00 | -0.033 92 | -0.029 01 |
| (C) Quadrupole moment | -0.032 25 | 0.015 91 | 0.009 05 |
| (A) + (B) + (C) | 9.832 10 | 9.780 32 | 9.787 77 |
Additional Note : Multipole expansion of the earth’s gravitational field
This part is for the more advanced readers and may be skipped for general reading. It explains the multipole expansions of the earth’s gravitational field using calculus.
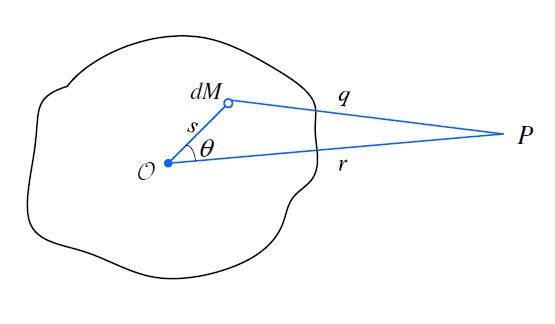
If the mass of a body is distributed in a volume V, then the gravitational field at point P due to the body is obtained by summing the effect of all the mass dM in the volume using equation (1). In this type of problem it will be easier to work with the gravitational potential U(P) which is a scalar quantity. The potential at P due to the mass dM is given by GdM/q. The total potential at P is given below.
 (10)
(10)
There is a well known mathematical formula to relate 1/q with r, s and cosθ. It makes use of the famous Legendre polynomials with P0(X) = 1, P1(X) = X and P2(X) = (3X2-1)/2, etc.
 (11)
(11)
or after expansion,
 (12)
(12)
Using the above equation, U(P) can be expanded as
 (13)
(13)
The first term on the right hand side of equation (13) is the monopole moment term. After integration, it becomes -GM/r. By differentiating U(P) against the spatial coordinates r, we obtain the gravitational acceleration GM/r2 which is exactly Newton’s law of gravitation for two point masses. If the object is a homogeneous sphere, only the monopole moment term in the multipole expansions is non-zero.
The second term is the dipole moment term. If the center of mass of the object is selected as the origin O, then the dipole moment term will be zero.
The third term is the quadrupole moment term. Since the earth is not a perfect sphere but an oblate spheroid flattened at the two poles, the quadrupole moment term will be non-zero. After integrating, its value is given below and depend on the direction of r.
 (14)
(14)
where A, B, C and I are the moments of inertia around the x, y, z axes and the r direction respectively. If we assume the mass of the earth is symmetrically distributed around the rotating axis, then A = B ≠ C and I = A + (C-A) cos2θ. It is common in geodesy to denote (C-A) as J2Ma2 where M is the mass of earth and a the equatorial radius. Finally, we can simplify (13) for earth to the following equation.
 (15)
(15)
There are high order moment terms (e.g. the octopole moment, 16-pole moment, etc) in the multipole expansions but their values are negligible for earth.
Differentiating U(P) against r, we obtain the gravitational acceleration as follows.
 (16)
(16)
On earth, θ is the co-latitude which equals to (90°-λ) where λ is the latitude. Expressing (16) in terms of the latitude, we have
 (16)
(16)
C.6 Putting it all together
To summarise, the following give a good estimate of the gravitation acceleration g at latitude λ to an accuracy of about 10-3。
 (17)
(17)
However, for metrology applications, this accuracy is not adequate. The actual value of g at a location depends also on the elevation, topography, rock density, inhomogeneities of the mantle and crust around the site. To obtain the accuracy suitable for metrology applications, g must be measured using gravimeters.
D. Measurements of the acceleration of gravity at the SCL in 1990 using relative gravimeters
In July 1990 a large scale gravity survey in Hong Kong, China was carried out by the British Geological Survey (BGS) for the Geotechnical Control Office (GCO) of the Civil Engineering Services Department and the Standards and Calibration Laboratory under the then Industry Department [4][5].
The LaCoste and Romberg Model G gravity meters, which are relative gravimeters, were used by the BGS for the 1990 survey. The reading accuracy was up to 1 x 10⁻⁷ m/s2. At that time, the LaCoste and Romberg Model G gravity meters were primary instruments used in the International Gravity Standardization Net 1971 (IGSN71), which was a worldwide network and a reference frame for absolute gravity measurements [6].
In 1970s, a total of ten IGSN71 base stations were established in Hong Kong, China. In 1990, only three were left. The 1990 survey by the BGS re-confirmed the consistency of these three remaining base stations and set up four new base stations. During the survey, seventy-one gravity observations were made at eighteen different locations (such as Science Building at The University of Hong Kong, Hong Kong Island, Han Tomb Entrance, Kowloon, Mui Wo Police Station, Lantau Island, Tai Mo Shan Trig Point, New Territories and etc) in Hong Kong. The measured acceleration of gravity ranged from 9.785 398 5 m/s2 to 9.787 624 9 m/s2.
On 5 and 6 July 1990, the BCS conducted gravity measurement at SCL’s Force Laboratory and the Mass Laboratory respectively located at the branch site in Kowloon Bay and the main laboratory in Wanchai Immigration Tower. The measured acceleration of gravity provided by the BGS were summarized in the Table 5. The measured uncertainties were 5 x 10⁻⁷ m/s2.
| Location | ||
|---|---|---|
| Force Laboratory, at ground floor, Kowloon Bay |
Mass Laboratory, at 35th Floor, Immigration Tower, Wanchai |
|
| The measured acceleration of gravity (m/s2) | 9.787 601 5 | 9.787 234 6 |
E. Measurements of the acceleration of gravity at the SCL in 2019 using absolute and relative gravimeters
The gravity values provided by the BGS have served SCL for over 25 years. As there were numerous developments in the surroundings of both the branch laboratory and the main laboratory, and recommendation was also raised by technical assessors, it was then decided that re-measurement of gravity value was deemed necessary. In February 2019, several experts from the National Institute of Metrology (NIM) of China were commissioned to measure the acceleration of gravity at the Force Laboratory, located in Kowloon Bay, and Mass Laboratory, Vibration Laboratory and Pressure Laboratory, located in Wanchai.
A high precision absolute gravimeter, Model NIM-3A [7], developed by NIM was set up in the Force Laboratory. The gravity values measured by the absolute gravimeter served as the reference datum. The absolute gravimeter works by dropping an object in a vacuum tube and measuring the time it takes to fall down a specified distance using a laser interferometer [8][9]. The acceleration of the test mass is calculated directly from the measured trajectory. The gravity values at the Mass, Vibration and Pressure Laboratories were then measured by using a relative gravimeter.
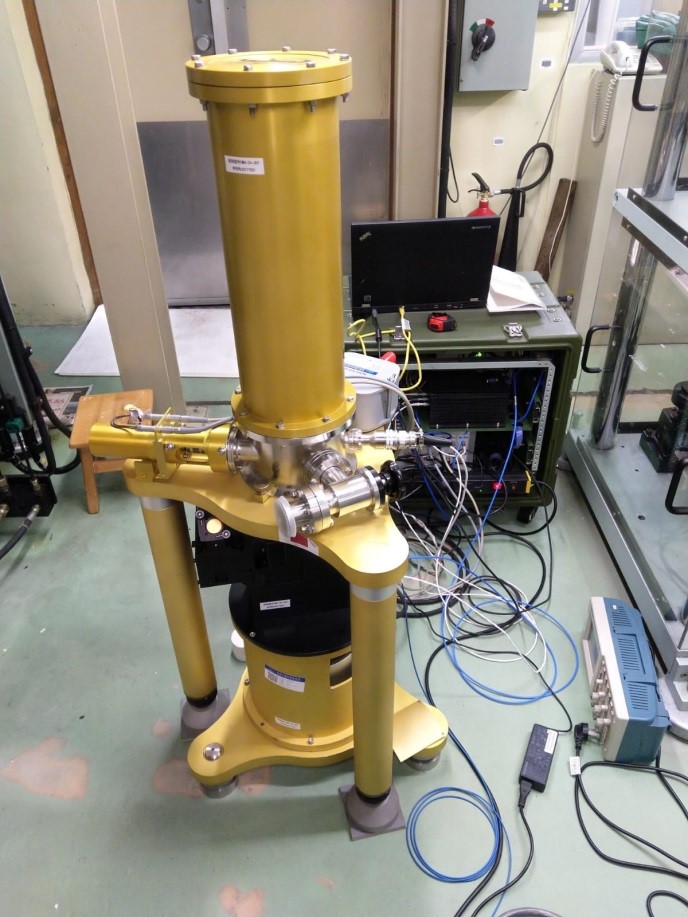
Fig. 4 Absolute gravimeter measuring the acceleration of gravity at the Force Laboratory
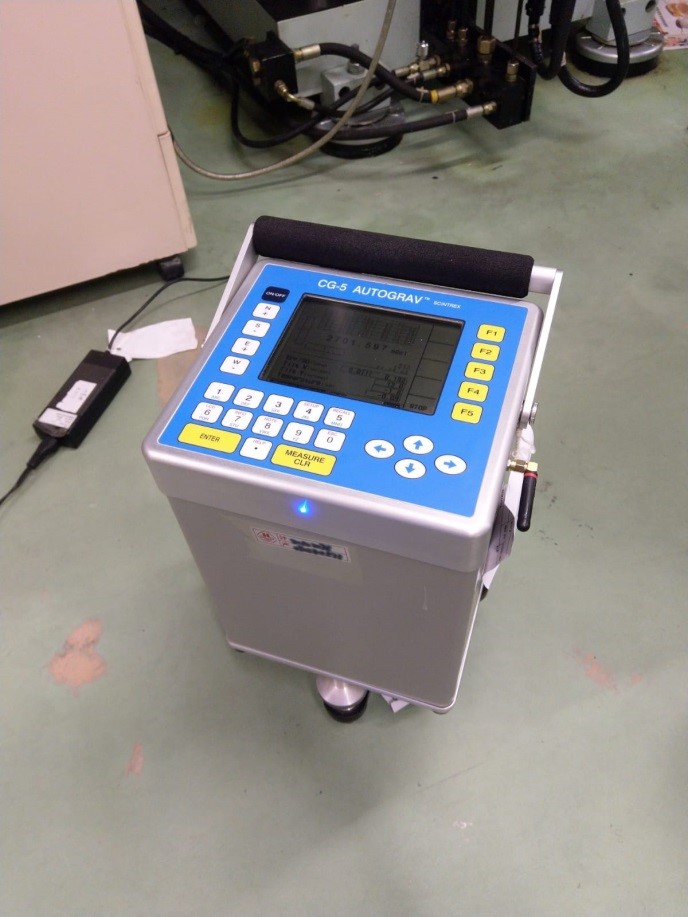
Fig. 5 Relative gravimeter measuring the acceleration of gravity at the Mass, Vibration and Pressure Laboratories
The measured acceleration of gravity by the NIM experts were summarized in the below table. The measured uncertainties were within 5 x 10⁻⁷ m/s2.
| Location | ||
|---|---|---|
| Force Laboratory, at ground floor, Kowloon Bay |
Mass Laboratory, at 35th Floor, Immigration Tower, Wanchai |
|
| The measured acceleration of gravity (m/s2) | 9.787 600 5 | 9.787 235 2 |
F. Comparing the on-site measured value of g at the Force Laboratory with the estimated values by theory
It is interesting to compare the on-site measured value of g with the estimated values by theory. The data is in Table 7. We observed that the value obtained by equation (6) has a 0.21 % difference with the on-site measured value for our Force Laboratory in 2019. After corrections for the earth’s rotation and the quadrupole moment due to the non-roundness of the earth, the difference drops to 0.002 %.
| Hong Kong (Force Laboratory) |
|
|---|---|
g given by  using equation (6) using equation (6) |
9.807 73 |
g given by  with corrections for earth’s rotation and the quadrupole moment using equation (17) with corrections for earth’s rotation and the quadrupole moment using equation (17) |
9.787 77 |
| g given by the IGF using equation (7) | 9.787 78 |
| On-site measurements by BGS experts in 1990 | 9.787 601 5 |
| On-site measurements by NIM experts in 2019 | 9.787 600 5 |
The Newton's law of universal gravitation applies to all objects. However, in deriving equation (6), some assumptions were made. One of the assumptions is that the two masses are both point masses; that is, their geometrical size does not matter. Also, the Earth is not a perfect sphere shape but rather an oblate ellipsoid. The density of the Earth is not homogeneous, distribution of the mass is not uniform, and the Earth is rotating. In addition, g will decrease with the elevation of the site at a rate 3.086 x 10⁻⁶ per metre (about -0.000 031 5% per metre). All of these factors explain the difference between the measured value of g with the estimated values.
References:
- Davis, R.S., “Equation for the determination of the density of moist air” (1981/91), Metrologia 29, 67 (1992).
- Giacomo, P., “Equation for the determination of the density of moist air” (1981), Metrologia 18, 33 (1982).
- Aziz, N., Majid, B. and Jorg, E. (2010), “Gravity and Magnetic Data Acquisition Over a Segment of the More-Trondelag Fault Complex”, NGU Report 2010.049.
- EVANS R B (1990). Hong Kong gravity observations in July 1990 with BGS Lacoste and Romberg meter No. G97 and international connections to IGSN 71. British Geological Survey Technical Report WK/90/24R.
- Busby, J.P., Evans, R.B., Lam, M.S., Ridley Thomas, W.N. & Langford, R.L. 1992. The gravity base station network and regional gravity survey of Hong Kong. Geological Society of Hong Kong Newsletter, Vol. 10, pp 2 - 5.
- C. Morelli, C. Gantar, T. Honkasalo, R.K. McConnell, J.G. Tanner, B. Szabo, U. Uotila, C.T. Whalen, The International Gravity Standardization Net 1971. Special Publication No 4 of the International Association of Geodesy, 1974.
- Wu Shu-qing, Feng Jin-yang, Li Chun-jian, Su Duo-wu, Wang Qi-yu and all the participants, CCM.G-K2.2017 CIPM Key Comparison of Absolute Gravimeters, Metrologia, Volume 57. Number 1A (2020).
- Li Chun-jian, Xu Jin-yi, Feng Jin-yang, Su Duo-wu, Wu Shu-qing, Correction of NIM-3A absolute gravimeter for self-attraction effect. Ninth International Symposium on Precision Engineering Measurement and Instrumentation, 2015
- Shuqing Wu, Tianchu Li. Technical Development of Absolute Gravimeter: Laser Interferometry and Atom Interferometry[J]. Acta Optica Sinica, 2021, 41(1): 0102002(in chinese)吳書清, 李天初. 絕對重力儀的技術發展: 光學干涉和原子干涉[J]. 光學學報, 2021, 41(1): 0102002
Photometry and Radiometry
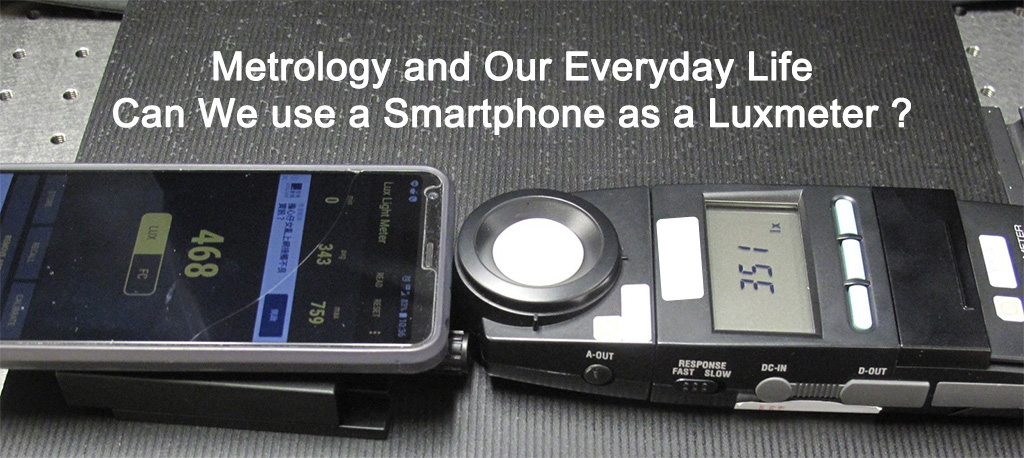
Can We use a Smartphone as a Luxmeter?
Brian HT Lee, Brenda HS Lam
Photometry and Radiometry Laboratory
Standards and Calibration Laboratory
1). Introduction
Smartphones are embedded with multiple sensors to provide instant feedback to the phone system for various applications. Many innovative developers make use of these embedded sensors to develop different interesting Mobile Applications (Apps). A Light Meter App is one of these interesting Apps that claims to provide convenient illuminance measurement for applications such as photography or lighting design. There are many Light Meter Apps in the market. Do they perform accurate illuminance measurements? Or, do they really perform illuminance measurement?
A light meter measures the illuminance, which is defined as the luminous flux per unit area (lm/m2) [4]. It is defined as

where Ev is the illuminance, A is the detector’s sensing area and Φv is received luminous flux at area A. The SI unit for illuminance is the lux (symbol: lx). Hence a light meter is also commonly called the luxmeter.
Luminous flux (in lumen, symbol: lm) is a photometric quantity of the ‘light power’ of a light source based on human eye’s sensation. It is the sum of the ‘light power’ at all radiation angles. An ideal light source has the same total luminous flux over sphere S1 and S2 as illustrated in Figure F1. A detector with sensing area A at different distance r1 and r2 will receive different portion of the total luminous flux in the ratio of  (i.e.
(i.e. ) . Therefore, the illuminance follows the famous inverse square law and is proportional to 1/r2:

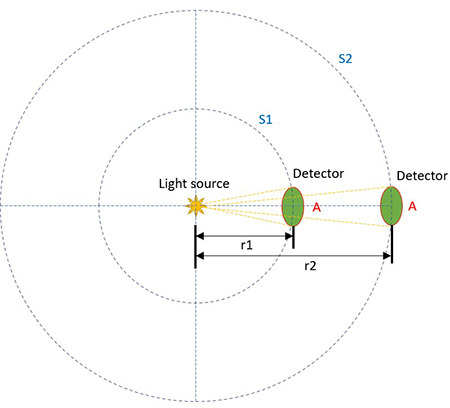 Figure F1. Inverse square law for illuminance. A is the sensing area of the detector.
2). Conventional light meter
A light meter is an instrument to measure the illuminance in photometry. The SI unit of illuminance is in lux (symbol: lx) which is equal to luminous flux per unit area (lm/m2). A conventional design of the light meter is shown in Figure 1. There are 3 key components, namely a cosine diffuser, a luminous function filter (or V(λ) filter) and a photodiode.
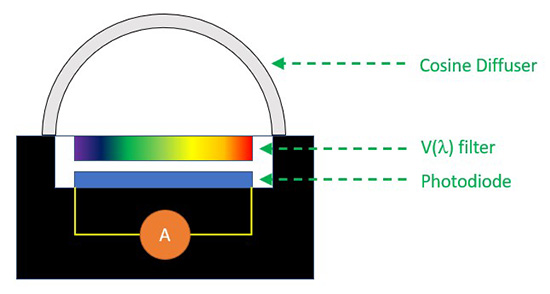 Figure 1. Key components of a light meter
In an illuminance measurement, the intensity level is proportional to the cosine of the incident angle of the light source, which follows the Lambert’s cosine law as shown in Figure 2. The cosine diffuser is a component that provides cosine correction according to the various incident angle. In general, the incoming light is not incident normally to the target area. For example, in a room environment as shown in Figure 3, our sensation of the “apparent brightness” of the room is influenced by the multiple light sources and the reflections by the environment coming from different angles. Therefore, a cosine diffuser simulates our eye’s spatial response and collects the lights with a reasonable acceptance angle.
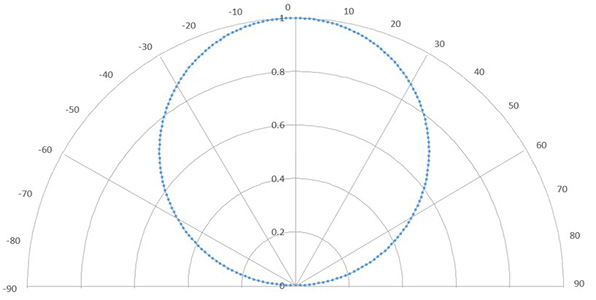 Figure 2. Lambert's cosine law
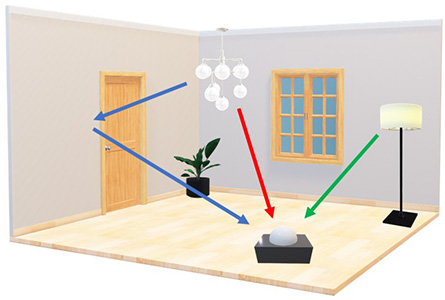 Figure 3. Illuminance in Room environment
A V(λ) filter is a bandpass optical filter which has different spectral transmittance in the visible spectrum. It is specially designed to complement the electrical characteristic of the photodiode to provide an overall relative spectral responsivity matching the spectral luminous efficiency function (or V(λ) function) of the human eye’s photopic response as shown in Figure 4 [1]. The human eye vision is limited to the visible spectrum (VIS, wavelength ~380 nm to 780 nm [1]) and is most sensitive to “green colour” (wavelength ~ 555 nm). Our eye’s sensitivity decreases at the blue and red wavelength regions and is unresponsive to ultra-violet (UV) and infrared (IR) lights. However, photodiode such as the silicon-type detector can respond to a wide spectrum including the VIS, UV and IR ranges. Therefore, the V(λ) filter is designed to block the UV and IR lights and provide an overall spectral responsivity matching the human eye V(λ) function. The photodiode in the light meter integrates all the lights fall under the visible spectrum and generates the output current in ampere (A) which is directly proportional to the lux value. With the known illuminance responsivity (A/lx) of the photodiode, the illuminance value can be measured.
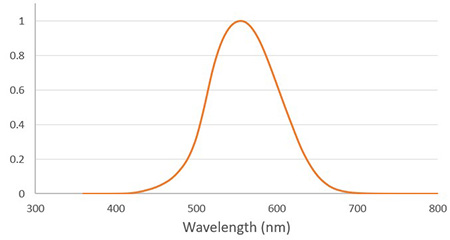 Figure 4. Luminous efficiency V(λ) function of the human eye
Transmittance is the amount of light transmitted through a surface, normalized by the amount of incident light. For example, a blue light blocking glass could be manufactured with reflective coating to reflect UV to Blue light and transmit the light in other wavelengths, as illustrated in Figure F1.
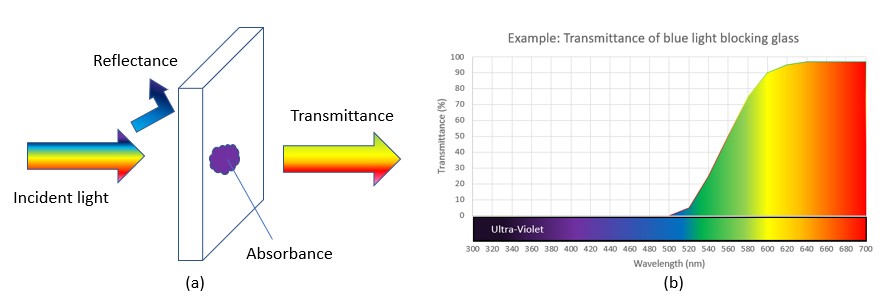 Figure F1. (a) Transmittance, Reflectance and Absorbance, (b) Transmittance of blue light blocking glass
3). Light Meter App for smartphone
Figure 5 shows an example of a Light Meter App for smartphones. The App provides the user a measured “lux value” from either the camera or the ambient light sensor (ALS) of the smartphone.
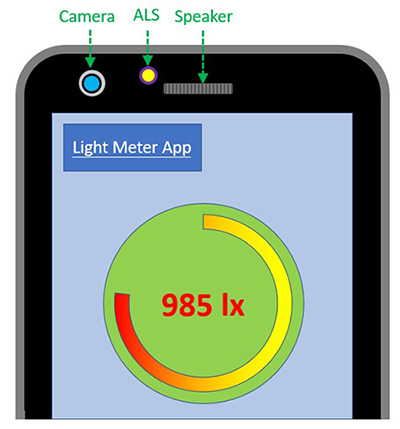 Figure 5. Light meter app example
There are two major types of Light Meter Apps for smartphones. One uses the ALS while the other uses the camera as the light detector. The first type (let’s call it the ALS type Light Meter App) is more common in Android phones where the ALS is open for use by software developers. For iPhones, the developers are discouraged from using the ALS, and any Apps using it will be rejected from App Store. Due to this limitation, most Light Meter Apps for iPhone use the camera as the light detector. Let’s call this the camera type Light Meter App.
The smartphone camera has more complicated optical designs for zooming and imaging. However, they are designed for photography but not for illuminance measurement purpose. The major difference between using the ALS and the camera as light sensor lies in the following.
- The ALS measures the illuminance directly.
When measuring illuminance with the ALS, the ALS should be placed at the target zone facing the light source. - The camera measures the luminance of the target zone (in photometry, luminance and illuminance are two different physical quantities).
When measuring the illuminance at the target zone, the camera is used to capture an image of the target zone and measures the luminance. The illuminance at the target zone is derived from the luminance by making assumptions on the reflectance of the target zone.
There is large uncertainty in estimating the reflectance of the target zone, hence the camera type Light Meter Apps has a lower accuracy than the type using ALS. This type of Apps is not discussed further below. The following discussion will focus on the measurements by ALS.
Broadly speaking, luminance means the brightness of the target zone. Formally, the luminance, Lv, at a given point in a given direction is the luminous flux (lm) per unit solid angle (sr) and per unit projected area (m2) perpendicular to the specified direction. Luminance is measured in lm/sr/m2 [4].
A camera senses the luminance of the target zone.
How does camera sensor measure illuminance?
In general, the camera images the target zone in focus at a confined angle and measures the ‘density’ of the luminous flux of the reflecting light from the target surface. If there is no change in the radiating power or the distance between the target to the light source, the ‘density’ of the luminous flux at the target region will maintain the same. Therefore, even the viewing distance from the camera is changed, the camera will provide the same luminance result by auto re-focusing the target surface.
Figure F2 illustrates how a camera estimates the illuminance. The target zone is illuminated by a light source with an illuminance Ev. The reflected luminance of the target surface, with magnitude depending on the illuminance Ev and the reflectance R of the surface, will be focused on the camera sensor. The camera will then derive the illuminance by making assumption on the reflectance (for example, based on previous test condition [5]). As there is large uncertainty in estimating the reflectance of the target zone, this approach would result in a lower accuracy in illuminance measurement.
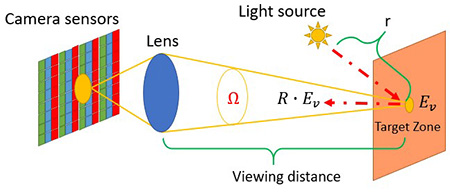 Figure F2. Imaging of the target zone on the camera sensors. The target is illuminated by a light source at a distance r. Assuming uniform illumination, Ev is the illuminance at the target zone and R is the localized reflectance of the surface. Ω represents the angle of the viewing system.
Experiment
A simple experiment is shown in Figure F3 to demonstrate the impact of the target zone reflectance on the readings of the camera type Light Meter Apps. A conventional instrument grade light meter and a smartphone running a camera type Light Meter App were set up to measure the illuminance at a target surface. With target zones of different reflectance, the camera type Light Meter App showed a large variation in illuminance reading from 38 lx of black background to 159 lx of white background, while the conventional light meter had a quite consistent reading of about 256 lx.
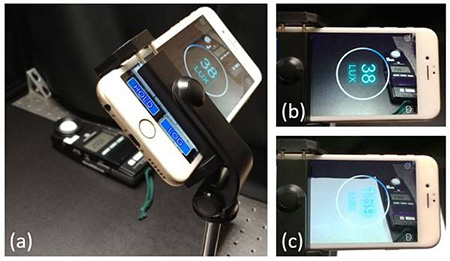 Figure F3. (a) Experiment setup with camera as reflected light meter; Illuminance reading from the camera viewing at (b) a black surface and (c) a white paper. The conventional light meter reading is about 256 lx.
The original purpose of the ALS is to detect the incident light level for automatic brightness control of the screen of the smartphone. A typical assembly layout of the ALS is shown in Figure 6. The ALS chip is embedded under the screen of the smartphone with a limited aperture size. The ALS chip is commonly fabricated with optical filter for visible light sensing. A molded lens might be manufactured or assembled with ALS chip to enhance the light coupling. Figure 7 illustrates the difference in light reception angle between a conventional light meter and the smartphone ALS. The protruded cosine diffuser design in a conventional light meter enables the capturing of incoming lights with higher incident angles. However, the embedded ALS design has a limited acceptance angle which could hardly produce a good cosine corrected measurement in an environment with multiple light sources (e.g. the red ray in Figure 7 cannot be captured by the senor).
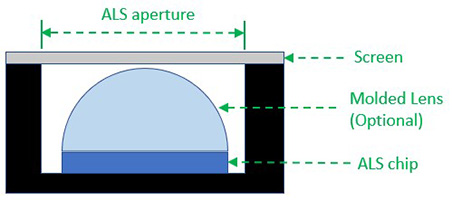 Figure 6. Typical ALS layout in smart phone
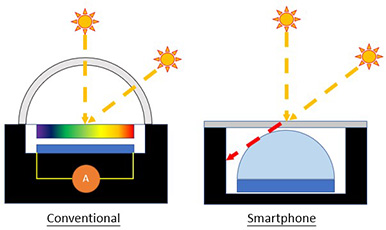 Figure 7. Incident light from different angle
Another critical factor for the illuminance measurement is the V(λ)-matching responsivity. Three common market-available ALS sensor chips are shown in Figure 8 with their spectral responsivities obtained from their datasheets.
Figure 8(a) is an ALS (Type A) with 4 different photodiodes that are responsive to red (R), green (G), blue (B) and white (W) colour spectrum. This type of ALS may also include an array of hyperspectral sensors for multiple visible colour sensing. The ALS chip or its software drivers will calculate the “lux” value by assigning different weighting factors to the sensing currents of the RGB sensors or the white sensor. The image sensor of a smartphone camera is similar to this type of ALS which includes multiple RGB sensors (or pixels). In one example, the light level is calculated from the output levels of the colour pixels using the weighted equation: (0.2126*R) + (0.7152*G) + (0.0722*B) [2, 3].
Figure 8(b) is a dual-channel ALS (Type B) which includes a broadband sensor and a Red-to-IR senor. The “illuminance” level is approximated by subtracting the output currents of the two sensors followed by multiplying the result with a correction factor.
Figure 8(c) shows another type of ALS (Type C) with a spectral responsivity that is close to the luminous efficiency function.
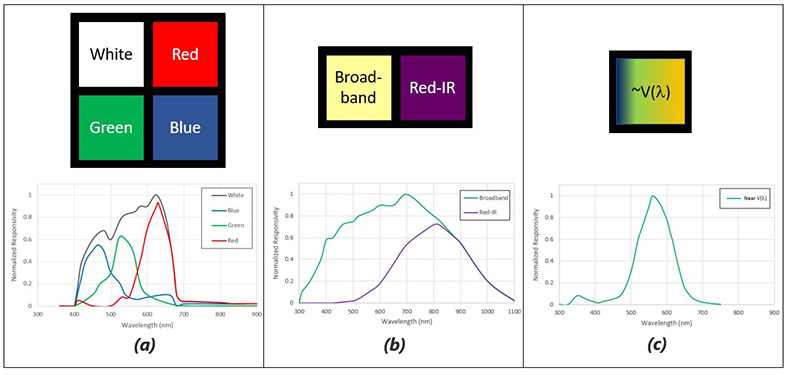 Figure 8. Typical ALS chips (a: Type A, b: Type B, c: Type C)
Figure 9 compares the normalized spectral responsivities of these three common types of ALS with the V(λ) function, where curve (a1) is the Type A white sensor’s spectral responsivity which has a passband in the visible spectrum; curve (a2) is the spectral responsivity of the Type A RGB sensor according to the weighted equation (0.2126*R) + (0.7152*G) + (0.0722*B); curve (b) is the net spectral responsivity of the Type B design after subtracting the Red-to-IR sensor’s response from the Broadband sensor’s; and curve (c) is the spectral responsivity of the Type C design. The plot shows that the Type A and Type B designs (i.e. curve a1, a2 and b) have very different spectral responsivities compared with the V(λ) function. The Type B design receives excessive UV and IR light in the measurement. The Type C design provides a closer match. However, the filter’s transmission spectrum is red-shifted and there is a small transmission peak at the UV wavelength range. Therefore, there are still rooms for improving the filter quality of the Type C design.
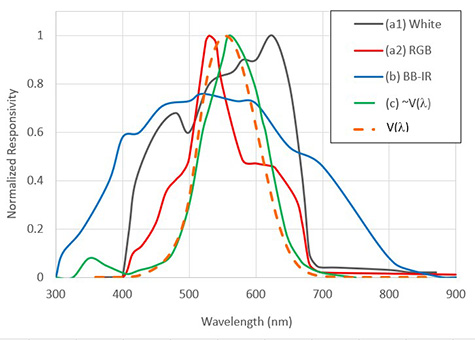 Figure 9. Normalized responsivities of Type A to Type C ALS compared with V(λ) function
4). Discussion
In Part 3, we observe that the ALS in smartphone may not be able to provide good cosine corrected illuminance measurement due to the limitation of the assembly design. There are also large variations in the spectral responsivity of different ALS chips which may not achieve a good V(λ)-matched response. To further understand the impact of the spectral mismatch, we compare the Type A sensor’s responsivity with the spectral power distribution (SPD) of a LED lamp and a Tungsten lamp as shown in Figure 10.
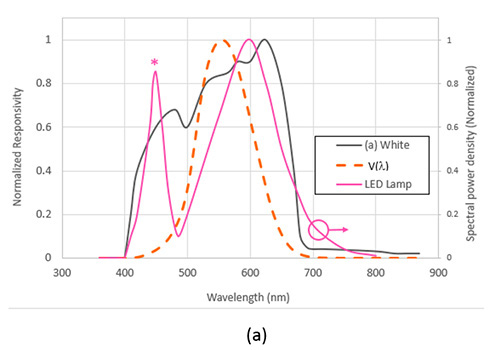
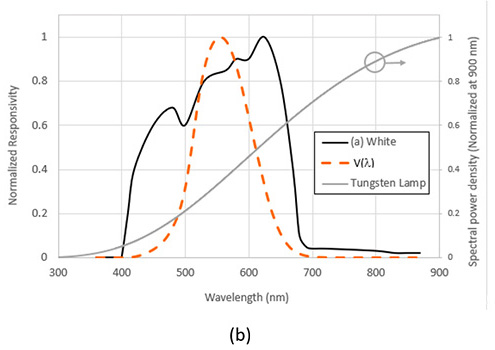
In both cases, the Type A white sensor receives more lamp power in the blue (~400 nm -500 nm) and red regions (~ 600 nm to 680 nm). For example, the blue peak (*) of the LED lamp at Figure 10(a) contributes significantly to the output current of the ALS sensor which create errors for the illuminance measurement. Furthermore, different smartphone models might be embedded with different ALS chips. The lux readings measured by the same Light Meter App in different smartphones could be model-dependent and the accuracy of the illuminance measurement could be unknown to the users.
In conclusion, although these Light Meter Apps can provide a convenient way of light measurement by the smartphone, users should pay attention to the limitations of these system if the accuracy of illuminance measurement is a concern.
Reference:
[1] ‘Illuminance meters – Requirements and test methods’, British standard BS 667:2005.
[2] ‘Smartphone-Based Light Intensity Calculation Application For Accessibility Measurement’, N. Negar et al., RESNA ANNUAL CONFERENCE – 2014.
[3] ‘Why You Should Forget Luminance Conversion and Do Something Better’, Rang M. H. Nguyen et al., 2017 IEEE Conference on Computer Vision and Pattern Recognition (CVPR).
[4] ‘Handbook of applied photometry’, C. DeCusatis; Optical Society of America, 1997
[5] Estimating luminance and illuminance with reflection-type exposure meters and an 18% neutral test card, Kodak, 1999
Time and Frequency
Is Time Running at the Same Rate at Different Places in Hong Kong, China?

Alvis Au Yeung, Steven Yang
Advanced Communication Laboratory
Standards and Calibration Laboratory
The SI base unit of time, the second (s), is defined by taking the fixed numerical value of the caesium frequency ΔvCs, the unperturbed ground-state hyperfine transition frequency of the caesium-133 atom, to be 9 192 631 770 Hz.
The Standards and Calibration Laboratory (SCL) is responsible for maintaining the reference standard of time and frequency for Hong Kong. Since 1986, SCL has been realizing the SI unit of the second by using caesium atomic clocks. The current atomic clock is accurate to 8 x 10-14. This clock will only make an error of 1 second in about 400,000 years.
 Figure 1. SCL’s caesium atomic clock
Time has deep meaning in physics. Many of us had heard of Albert Einstein’s relativity theories which say that time is not absolute. This leads to the profound question: is time running at the same rate at different locations in Hong Kong, China? Will our atomic clock keep the same time when placed at, for example: (a) Avenue of Stars; (b) the summit of Tai Mo Shan?
 (a)
(a)
 (b)
(b)
To answer this question, we need to dig deeper into Einstein’s theory. Actually there are two relativity theories – the special and the general relativity theory. In 1905, Einstein published the theory of special relativity which introduced the new concept of space-time. The three dimensions of space and the one dimension of time are fused into one 4-dimensional space-time. Time is not absolute and depends on the relative motion of the reference frames of the observer and the clock. In simple words, an observer will find that a clock moving relative to him runs slower. This is the Lorentz time dilation named after the Lorentz transformation that relates the space-time coordinates of two inertial frames moving at constant speed relative to each other.
Even if the observer and the clock are stationary to each other, time dilation can still occur. There is another type of time dilation, the gravitational time dilation, which was predicted by the theory of general relativity published by Einstein in 1915.
After 1905, Einstein found that some accepted physics theories, including Newton’s theory of gravity, were inconsistent with the theory of special relativity. To resolve the incompatibility, Einstein proposed the theory of general relativity which offered a radically different view of gravity. In Newton’s theory, gravity is treated as the attractive force between objects due to their masses. In Einstein’s theory, gravity is a result of the curvature of space-time created by massive objects (Figure 3).
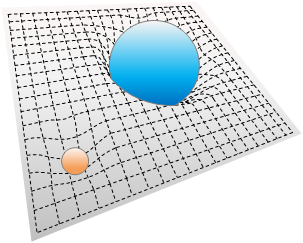 Figure 3. Curvature of space-time
In simple words, matters (in a broader sense including mass, energy and momentum) will warp the 4-dimensional space-time around it. Other objects moving in this curved space-time will appear to be affected by a force we used to call the gravity.
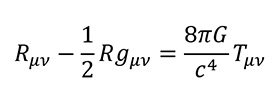
In the theory of general relativity, the famous Einstein’s field equation relates the space-time geometry with the matter distribution.
 (1)
(1)
This is a tensor equation which involves advanced mathematics. We can only give a very brief introduction here. The parameters Rµν, R and gμν represent the curvature of the space-time while Tµν, called the energy-momentum tensor, represents the effect of the massive object. G is the gravitation constant and c the speed of light.
As massive object will warp the space-time around it, the time, being a component of the 4 dimensional space-time, will flow at a different rate depending on the strength of the gravitational field. This is the origin of the gravitational time dilation. In summary, the stronger the gravitational field, the slower will the clock run.
To compute the effect of the gravitational time dilation, we can use the following equation derived from the Schwarzschild solution to the Einstein’s field equation.
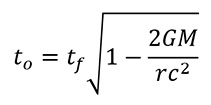 (2)
(2)
where
G : Gravitational constant - 6.6743 x 10⁻¹¹ Nm2/kg2
M : Mass causing the gravitational field
r : Distance from the center of the mass
c : Speed of light in vacuum - 299792458 m/s
tf : Time flow of a reference observer at infinite distance from the mass.
to : Time flow of the object at distance r from the mass
For earth, the values for M is about 5.9722 x 1024 kg. In Hong Kong, China, the value of r is around 6.375 x 10⁶ m.
Now, we go back to the question: will the elapsed time be the same at the Avenue of Star and the summit of Tai Mo Shan? To determine the answer, we need the altitude information of these locations :
Avenue of Stars : 5 m *
Tai Mo Shan : 957 m *
* Height above the Hong Kong Principal Datum (HKPD), which is about 1.3 m below the mean sea level.
 Figure 4. Time flow at different altitude
Then, we could express the time flow of an object at the Avenue of Stars (taos) and at summit of Tai Mo Shan (ttms) as:
 (3)
(3)
 (4)
(4)
Let’s take the ratio of ttms to taos
 (5)
(5)
The calculation shows that an atomic clock at the summit of Tai Mo Shan runs 1.000 000 000 000 104 time faster than it does at the Avenue of Stars. There are 86 400 seconds per day, therefore the atomic clock will run 9 ns faster per day when being moved from the Avenue of Stars to the Tai Mo Shan summit.
The gravitation time dilation will only affect the most accurate atomic clock. The relative time dilation is about 1 part in 1016 per altitude difference of 1 m at the surface of the Earth. This will have negligible effect on common time and frequency measurement instruments.
Shortly after Einstein published his field equation in 1915, Karl Schwarzschild discovered an exact solution for the gravitational field outside a spherical mass.
When there is no gravitation field, the space-time is flat and the interval between two events, ds, in spherical coordinates, was given by :
 (6)
(6)
Karl Schwarzschild found that in the presence of a spherical mass M, the space-time would be warped according to the Einstein field equation. The above equation became the following. This is also called the Schwarzschild metric.
 (7)
(7)
The equation for the gravitational time dilation can be obtained readily from the Schwarzschild metric.
Dialogue with my 11-year-old-son on quantum physics
(Part 1: atomic clock and the hyperfine transition of the caesium-133 atom)

Terry Lai
Radio Frequency Laboratory
Standards and Calibration Laboratory
One night at around 9:30 pm
Dad, can you tell me a story?
Sure, but please wait a second!
I am ready, are you ready now?
Yes, I am ready. I have waited for many seconds! Your one second is so long! Are we living in a parallel universe?
Oh, daddy needs to finish up the task at hand, please don’t mock me. Since you are learning the time unit conversion in your mathematics class, let me tell you a story about the second.
A story about the second? It sounds very interesting and I have never heard of this before.
The second is the unit of time, which is one of the seven base units in the International System of Units (SI). It can be commonly understood as 1/86400 of a day.
Yes, there are 86400 seconds in a day and can be calculated by 60 seconds x 60 minutes x 24 hours.
Then, for each tick-tock of a clock which is one second, do you know how to define its interval?
I guess that scientists may use equipment to count the total number of seconds of one year and then compare it with their clocks.
It is a good idea to compare this quantity by comparison, but it may be impractical, do you know why?
This method seems not practical because we need to collect time data for very long time. Besides, my teacher told me that the Earth's rotation speed was not stable.
Yes, that’s true. That is why scientists have to add leap second occasionally, and there is recent news about scientists are debating to add a negative leap second to compensate for the faster earth rotation in 2021, so we cannot have a constant reference for comparison. What other methods do you think are possible?
I guess just like a ruler used to measure length, we may be able to improve accuracy by using a finer length. We may use a finer time scale to define the interval of one second. If we can find something that can click at a very stable rate and much quicker than a second, it may be useful.
This is a good way! With the development of quantum mechanics, scientists no longer measure time against the movement of the Earth but against the frequency related to some kinds of atoms. The method of monitoring its frequency has replaced the observations of astronomers.
How can we relate time to the frequency of atoms?
We use the atomic clock. The International Atomic Time (TAI) was established using around 400 atomic clocks maintained worldwide as the reference for time.
Does Hong Kong have atomic clock?
(Smiling) Of course we have. There are two caesium atomic clocks in my laboratory, which are used as the frequency standard for Hong Kong. I was once responsible for operating them. Let me show you a photo.

Wow! That’s great. I want to know more. What is an atomic clock, and how the second is defined with it?
I give you the formal answer first. See if you can understand it.
Caesium-133 atom was selected to define the unit of second in 1967 by the International Bureau of Weights and Measures (BIPM). The definition of second was last revised on 20 May 2019, and its definition is:
The second, symbol s, is the SI unit of time. It is defined by taking the fixed numerical value of the unperturbed ground-state hyperfine transition frequency of the caesium-133 atom, to be 9 192 631 770 when expressed in the unit Hz, which is equal to s–1.
I do not understand a single word of it!
Don’t worry. You will understand them when you grow up and study science at university.
But I want to understand it now. Can you explain it in simpler ways?
Okay. Let me try.
What is caesium?
Caesium is a metal that melts at 28.5 °C and has a silvery-golden color. It will react explosively with water. So it is a hazardous material.
Is it dangerous for you to work with caesium atomic clock?
No problem. The atomic clock contains only a very small amount of caesium and it is hermetically sealed in a tube.
What does the number 133 in caesium-133 mean?
An atom is make up of three types of elementary particles, namely the electron, the proton and the neutron. The total number of protons and neutrons is called the mass number of the atom. A caesium atom always has 55 protons and 55 electrons but may have different number of neutrons. Caesium-133 is a type of caesium atom with 78 neutrons. The mass number equals to 55 + 78 = 133.
I know what electron, proton and neutron are. I recently read a book about science. It said electron, proton and neutron are tiny particles with negative, positive and no electric charge on it. It also said protons and neutrons are located at the nucleus of the atom, and the electrons are moving around the nucleus. Different atoms have different numbers of electrons, protons and neutrons. Everything in the world is made up of atoms!
Excellent! I do not know you knew so many things. You are right indeed. Let me draw it on the electronic blackboard......
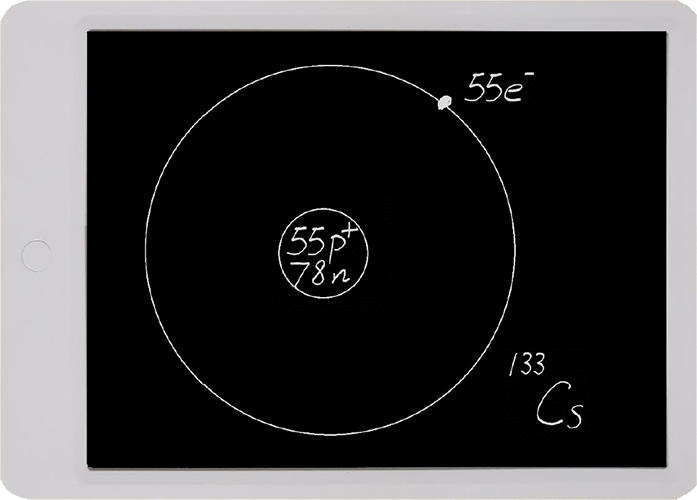
The electrons at the outer ring and the nucleus at the center look just like the moon orbiting around the earth.
Well, the actual picture is a bit complicated. I only drew a point as the 55 electrons in this picture. But it will be easier to understand by thinking this way.
Caesium atom has 55 electrons. That means there are 55 moons. I cannot imagine how they are distributed?
You may imagine they distribute like the Saturn ring. The Saturn ring consists of several layers. Each layer consists of different number of comets, asteroids or shattered moons. The electrons distribution of a caesium atom, or other atoms, is similar to this.
There are six layers of electrons for caesium. In quantum physics, these layers are typically called energy levels (n) and each level has different number of electrons. Let me draw the distribution of electrons on the blackboard. There is only one electron in its outermost orbit.

Can the electrons move from one energy level to the other?
Yes, they can.
If an electron moves from a level with higher energy to another level with lower energy, a particle of light, called the photon, will be emitted.
Can we see the light of the photon?
It depends on the frequency of the light. Frequency means the rate of oscillation.
So the 9 192 631 770 Hz you mentioned is the frequency of the photon.
Exactly!
Can we see the photon with frequency of 9 192 631 770 Hz.
No, we can’t. The frequency is too low for our eye to see it. But we can use electronic circuit to detect it. Just like the one we used in the atomic clock.
What determine the frequency of the photon?
It depends on the difference between the two energy levels. We can use the following equation to calculate it. h is the Planck constant. Planck was a very clever scientist. He obtained the Nobel prize in physics in 1918.

If 9 192 631 770 Hz is a low frequency, does this mean the energy difference between the transition from E2 to E1 is small?
Yes, that’s why we called it the hyperfine transition.
I remember you drawn a diagram having many horizontal lines around two years ago. You love the diagram very much so you have put up this diagram on your working desk. Is it related to the hyperfine transition?
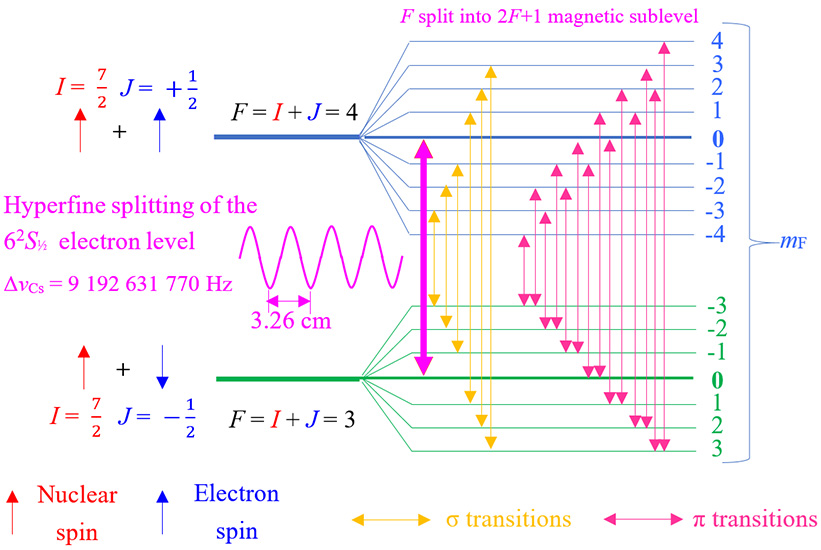
Yes. I told you I was responsible for operating the caesium atomic clock in my work as the frequency standard for Hong Kong. So I need to understand this diagram.
It looks supercool. Explain it to me.
No, that will be too difficult.
What is F?
...
What is mF? Why there are so many levels for mF?
...
You often teach me “Rome wasn't built in a day; Learning is the same way. Knowledge is a product of the lifelong attempt to acquire it.”. Something I may not understand at this moment, maybe inspire me later......
Come on!
Okay. Let see if I can make you understand. F is what we call the total angular momentum of the Cs-133 atom.
Total angular momentum! That’s a mouthful.
The idea is actually very simple. You know what a spinning top is. It spins. The electron, proton and neutron all spin like spinning tops. The angular momentum is a measure how fast these particles spin. For electron, proton and neutron, their angular momentums have only two values, either +1/2 or -1/2. We usually just call their angular momentum as spin.
So an electron cannot have angular momentum of other values such as 0 or 1.23?
No, the angular momentum of electron, proton and neutron can take on only discrete values. That is why we call this branch of science the quantum physics.
Why angular momentum behaves like this?
No one knows the reason. Not even Einstein. The nature just behaves this way.
By total angular momentum, are we saying F equals to the angular momentum of all 55 electrons, 55 protons and 78 neutrons?
In a sense yes. Fortunately, most of the electrons, protons and neutrons exist in pairs with opposite spins which cancel each other. So we can simplify the picture, the total angular momentum F of a Cs-133 atom depends on the spin J of the outermost electron in the n=6 level and the spin of the nucleus I.
So F = I + J?
Something like that. In quantum physics there is special rule to add two spins together. J has a value of 1/2 and I has a value of 7/2. Depending on the relative orientation of the spin of the outermost electron with the nucleus, the total spin F equals to either |I - J| which is 3 or |I + J| which is 4.
F = 3 and F = 4 are the two hyperfine levels?
Right! You are so clever.
Why the two hyperfine levels have different energy?
It is because the electron and the nucleus are tiny magnets. The two hyperfine levels correspond to whether the two magnets points to the same direction. Let me draw it on the blackboard. Do you think it is easier for the magnet representing the electron to stay at the F=3 state or the F=4 state?
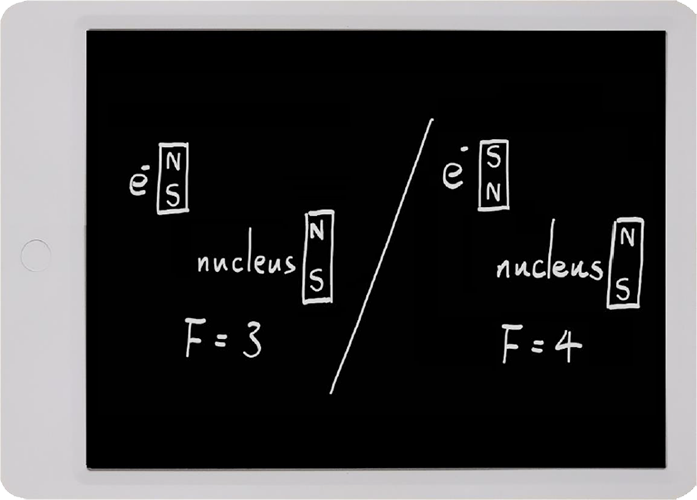
My teacher told me that the north pole of a magnet will attract the south pole and repel the north pole of another magnet. So I think it is easier to remain at the F=3 state.
Right. We need to spend extra energy to bring the atom from the F=3 state to the F=4 state. Therefore there is an energy gap.
Why we called it the hyperfine transition? Do we have “not fine transition”?
The energy difference between the F=3 and the F=4 state is very small because the magnetic field of the nucleus is much weaker than that of the electron.
Why the magnetic field of the nucleus is weak?
It is because the protons and neutrons which make up the nucleus are much heavier than electrons. And the magnetic field of a particle is inversely proportional to its mass. You have to believe me on that as I cannot tell you why the nature behave like this.
Why there are so many mF levels?
As I have said, the electron, proton and neutron are tiny magnets. If there is an external magnetic field applied to the Cs-133 atom, magnets at different orientations will have slightly different energies. As a result the energy level will be split further.
When F = 4, I found 9 mF levels.
Yes, the magnet field will split the hyperfine level with F to (2F + 1) sublevels.
When F = 3, (2F + 1) equals to 7, so we will have 7 sublevels.
Correct!
So any of the 9 sublevels at F=4 can transit to the 7 sublevels at F=3. Didn’t we have a great number of transitions? And each transition will have a different frequency?
In atomic clock, we only make use of the transition from (F = 4, mF = 0) to (F = 3, mF = 0). This is marked on the diagram.
Is it the hyperfine transition for the generation of the 9 192 631 770 Hz frequency?
Yes, in summary the hyperfine structure is caused by interaction between magnetic fields from electron movement and nuclear spin.
Now I have learnt more about the energy transition and the hyperfine transition frequency of the caesium-133 atom. I have one more question. We have spent so much effort to define a second, and to have a very complicated system. Actually, why do we need to have a clock with such a high accuracy. This accuracy may not be necessary for general people, isn’t it?
I guess that many people may have the same question. However, in the human history, there were ample examples that more accurate measurements would lead to breakthroughs in science and technology development. Let me show you an example. In the 19th century, Albert A. Michelson had improved the design of his interferometer and was able to measure the speed of light at great precision. He found that the speed of light was a constant. The results led to Albert Einstein’s relativity theories.
I see.
The following chart shows the relationship between the SI base units. It can be seen that other than the base unit mole, all the other 5 base units are depending on the second. If we can improve the precision of time, the precision of all these 5 SI base units can be benefited.
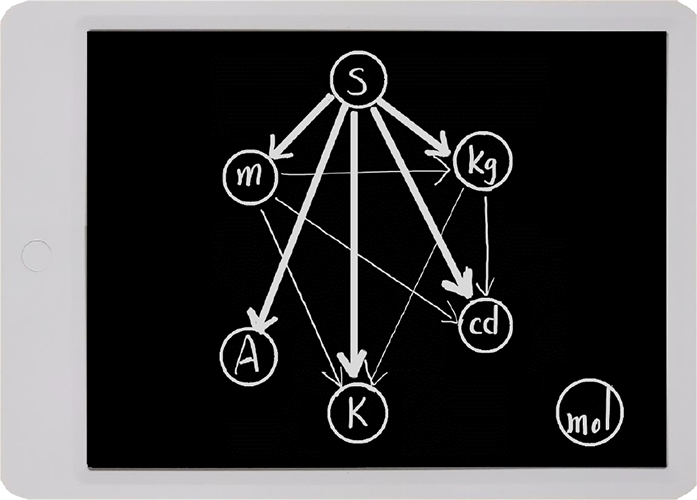
Who contributed the most in the development of using caesium 133 to define the SI base unit of time? Was it by my role model, Albert Einstein?
Albert Einstein revolutionized physics with his theories of special and general relativity. He was a great scientist. But there were many others who had made contributions to modern science including Thomas Young, James Clerk Maxwell, Heinrich Hertz, Wolfgang Pauli, Albert Abraham Michelson, Max Planck, etc.
Just like in a soccer team, it requires everyone, including the players, the coach, the medical team, etc., to contribute. It is not possible to succeed without everyone’s effort.
I wish one day I can make contributions to science discovery.
I am very glad to hear that.
Why you two are still talking at 11:30 pm! Tomorrow you two will need to wake up early for school and work!
The story is very interesting. I don’t want to sleep now.
Oh, you can continue tomorrow.
Let’s continue the story tomorrow.
Ok, good night!
For the electron spin, I am thinking of something.
What’s that?
Inception......
LOL......Let’s access our unconscious mind.
(In Dad’s mind......How will our conversation become after ten years? Will he study science and engineering in future? Let me write a letter about quantum physics for him to take a look after ten years......)
Zzz.................
(to be continued)
Thermometry
Is the Physical Meaning of Temperature Really so Hard to Understand?

Brenda Lam, Julian Cheung
Temperature Laboratory
Standards and Calibration Laboratory
Temperature is Not Simple
Temperature affects our daily life. Everyone knows temperature is related to the sensation of warmth and cool. However, very few people will think about the physical meaning of temperature.
For those who do, they will find out that temperature is intricately connected with the second law of thermodynamics. It is for this reason that in the International System of Units (the SI), the term “thermodynamic temperature” is specifically adopted for this quantity. For simplicity, we use the term “temperature” to refer to “thermodynamic temperature” in the remaining part of this article.
Among the quantities represented by the seven SI base units, it was said that the physical meaning of temperature is the hardest to understand. Let’s see if we can disprove this assertion.
The Simplest Definition of Temperature
Temperature should be a quantity such that energy always flows from place with higher temperature to that with lower temperature. When there is no energy flow between two objects in thermal contact, they are at the same temperature. This is the fundamental definition of temperature.
Unfortunately, this definition does not allow us to do much. To understand what the term temperature means, we need to study energy and statistical theory in more details.
The Intertwining of Temperature and Energy
In the 9th edition of SI Brochure (2019), it was stated that “The Boltzmann constant k corresponds to a conversion factor between the quantities temperature (with unit kelvin) and energy (with unit joule), …”
and
“the temperature of a system scales with the thermal energy, but not necessarily with the internal energy of a system.”
Clearly temperature is closely linked with energy. What are their relationships?
Is Temperature Just Another Name for Energy?
Suppose we have a sample of gas with mass = m, energy = U, volume = V, temperature = T and pressure = P. If we add an identical sample, the combined gas sample will have the following properties: mass = 2m, energy = 2U, volume = 2V, temperature = T and pressure = P.
| Sample Gas 1 | Sample Gas 2 |  |
Combined Sample Gas |
|---|---|---|---|
|
mass = m energy = U volume = V temperature = T pressure = P |
mass = m energy = U volume = V temperature = T pressure = P |
mass = 2m energy = 2U volume = 2V temperature = T pressure = P |
We can see that the values of mass, energy and volume are proportional to the size of the system. They are called extensive properties. On the other hand, the values of temperature and pressure are independent of the size of the system. They are called intensive properties. Intensive property is usually the ratio of two extensive properties.
It is apparent that an extensive property cannot be an intensive property at the same time. Temperature and energy are different things.
How About Defining Temperature as the Average Kinetic Energy of Particles in a System?
This is much better as the average kinetic energy of particles (such as molecules or atoms) is an intensive property. In fact, this is a common way to explain the physical meaning of temperature in introductory physics course.
For a monoatomic ideal gas, the internal energy consists of translational kinetic energy of the atoms. We can obtain the following result where U is the internal energy, N is number of particle, k is the Boltzmann constant and T is the temperature.
 (1)
(1)
This result relates temperature directly to the average kinetic energy (U/N) of the atom.
However, things get complicated for diatomic gas, liquid and solid. In these substances there are forms of internal energy other than translational kinetic energy, such as rotational kinetic energy, vibrational kinetic energy and potential energy. While using average kinetic energy to explain temperature is easy to understand, it becomes less satisfactory as a definition. We need a more rigorous and universal definition.
How Temperature is Defined in Most Textbooks of Thermal Physics?
In most textbooks of thermal physics, temperature is defined as follows.
 (2)
(2)
Literally, temperature is the reciprocal of the rate of change of entropy against change of internal energy with the system’s volume and number of particles kept at fixed values.
To convey scientific ideas precisely, mathematical equations using calculus symbols are commonly found in textbooks of physical science. For example, the definition for temperature T is usually written as follows.
 (3)
(3)
where T is the temperature, S is the entropy, U is the internal energy of the system, V is the volume and N is the number of particles of the system.
This equation is not as intimidating as it looks even if you have not studied calculus. If we plot the entropy S against the internal energy U of a system in a graph, the partial differentiation  is merely the slope of the curve with the system’s volume V and number of particles N kept fixed. The temperature is the reciprocal of this slope.
While the equation looks simple, the hard part of course is to understand what entropy means. It took scientists in the 19th century several decades to decipher its meaning. It is the main reason why many people think the physical meaning of temperature is difficult to understand. However, it has been over a hundred year since the nature of entropy was clearly elucidated by scientists in the statistical mechanics field. With some patience, we should be able to grasp its essence.
What is Entropy?
In 1877, Ludwig Boltzmann gave the following definition for entropy,
 (4)
(4)
where S is entropy, k is Boltzmann constant and W (multiplicity) is the number of quantum states accessible to the system. This is one of the most famous equations in thermal physics. It was engraved on the tombstone of Boltzmann.
To understand this equation, we need to know what are macro-state and micro-state. The macro-state of a system refers to the macroscopic properties such as temperature and pressure. The micro-state is a specific microscopic arrangement of a system at a single moment.
For each macro-state, there are many micro-states which result in the same macro-state. This is called the multiplicity of the macro-state. The logarithm of the multiplicity is the entropy.
The fundamental assumption of statistical mechanics states that in an isolated system in thermal equilibrium, all accessible micro-states are equally probable. Therefore, if there are two macro-states, the one with more microstates, i.e., higher multiplicity, will be more likely to occur.
Similarly, when an isolated system approaches thermal equilibrium, it will most likely be in the macro-state with the largest number of micro-states, i.e., the largest entropy. Away from equilibrium, the system will more likely move towards macro-states with larger entropy. In other words, entropy always increases. This is the famous second law of thermodynamics.
To give a rough idea on the magnitude of the multiplicity, let us consider a sample of 0.001 m3 of helium gas at 23℃ and 1 standard atmospheric pressure, the entropy S given by the Sackur-Tetrode equation is 5.15 JK-1. The number of micro-state W = e3.73x1023. This number is so huge that it will overflow your calculator.
For monoatomic ideal gas system, the entropy is given by the Sackur-Tetrode equation. It was independently developed by Otto Sackur and Hugo Martin Tetrode in about 1912.
 (5)
(5)
where
N = number of atoms, V = volume of system, m = mass of an atom, U = internal energy and h = Planck’s constant
Entropy, Temperature and Direction of Energy Flow
The following combines the concept of entropy and the fundamental assumption of statistical mechanics to explain why defining temperature as equation (3) will give the expected result that energy will always flow from higher temperature to lower temperature. You will need some efforts to understand this material but the results will be rewarding. Background in calculus is not required.
Let two systems with internal energy U1 and U2 be in thermal contact. w1(U1) and w2(U2) are the number of accessible microstates for these two systems. The total number of accessible microstates for the combined system wc(U1, U2) is given by the following.
 (6)
(6)
We have earlier defined entropy S = k log w. Taking the logarithm of both sides.
 (7)
(7)
This shows that entropy is an extensive property. The total energy of the combined system is Uc = U1 + U2. For an isolated system, Uc is conserved. We have Sc(U1, U2) = S1(U1) + S2(Uc - U1) and Sc(U1, U2) can be simplified to Sc(U1).
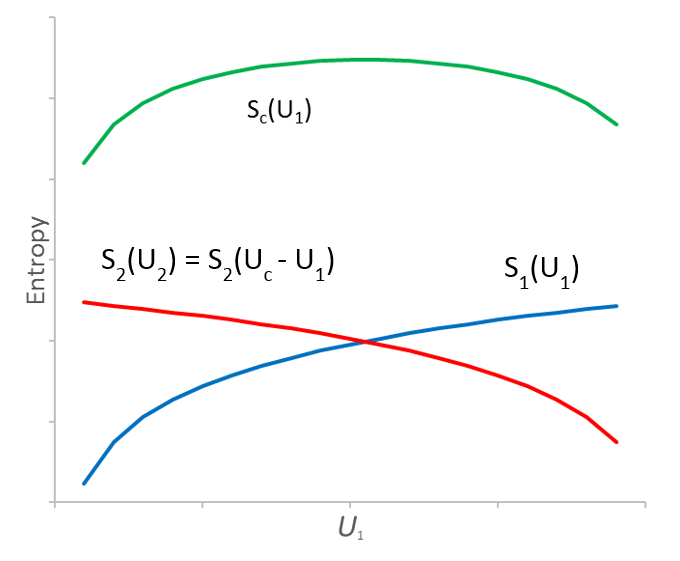 Figure 1. Changes in entropy with energy flow for two systems in thermal contact
When there is energy flow ΔU from system 1 to 2, U1 decreases by ΔU while U2 increases by ΔU. The value of Sc(U1) will also change. The relationship of these quantities are plotted in Figure 1. By the fundamental assumption of statistical mechanics, ΔU will flow in a direction so that the value of wc(U1, U2), and in turn Sc(U1), increases. The change in Sc(U1), denoted by ΔSc(U1), is larger or equal to zero. ΔSc(U1) can be calculated as follows.
 (8)
(8)
Let’s denote the rate of change of S1(U1) to U1 as  , then
  . Similarly we have
  . ΔSc(U1) becomes the following.
 (9)
(9)
Since ΔSc(U1) ≥ 0, if ΔU > 0 (i.e. energy flow from system 1 to 2), we have
 (10)
(10)
Therefore, temperature defined as the reciprocal of the rate of change of entropy S with respect to the internal energy U is consistent with the expectation that energy flows from higher temperature to lower temperature.
We hope after reading this, you will have a better understanding of the physical meaning of temperature and entropy.
The following discussion is for those who are comfortable with calculus.
The total energy of the combined system is Uc = U1 + U2. The total energy Uc is conserved. When there is energy flow between the 2 systems, we have dU1 = -dU2.
The total number of accessible microstates for the combined system is given by
 (11)
(11)
By the fundamental assumption of statistical mechanics, the values of U1 and U2 will change in such directions so that wc(U1, U2) tends to increase, i.e. dwc ≥ 0.
 (12)
(12)
Since dU1 = -dU2, we have
 (13)
(13)
Using the identity  , we obtain
 (14)
(14)
Since the entropy S = k log w, we have
 (15)
(15)
if dU1 < 0 (i.e. energy flow from system 1 to 2), we have
 (16)
(16)
Therefore, temperature defined as equation (3) is consistent with the expectation that energy flows from a system with higher temperature to that with lower temperature.
Sensing the water vapour

Brian HT Lee, Brenda HS Lam
Humidity Laboratory
Standards and Calibration Laboratory
1). Sensing the water vapour
In summer, the relative humidity will go up to over 90 %RH. We can feel the hot and sticky environment and sense the invisible water vapour around us. Can you imagine if we visualize the water vapour through a simple experiment? If you wear glasses, you will get the answer easily from your daily life experience. When you go out from an air-conditioning environment in summer, your glasses get fog-up with countless tiny water droplets. The water vapour in the air condenses on the cold lenses of your glasses. This condensation phenomenon looks simple, but the physics behind is one of the bases for the precise measurement of relative humidity.
 Figure 1. Water droplets on a cold lens of the glasses
2). What is relative humidity?
Humidity is the presence of water vapour in gases. In hygrometry, which is the science for humidity measurement, there are different ways to quantify the humidity such as relative humidity, dew-point temperature and the mole or mass fraction of the water vapour. Among those, relative humidity is the most common term to be used.
Air carries water vapour with a limited capacity. The maximum capacity of air to hold water vapour is defined as the saturation vapour pressure ew(t) [Unit: kPa], which is a function of temperature t as shown by the saturation line in Figure 2. Relative humidity [Unit: %RH] is the level of the vapour pressure presented as percentage of the saturation vapour pressure. For example, the water vapour pressure at 10 %RH and 50 %RH are plotted in Figure 2 for reference. If the water vapour pressure reaches the saturation vapour pressure, the relative humidity is equal to 100 %RH and the water vapour in the air condenses as dew (i.e. water droplet).
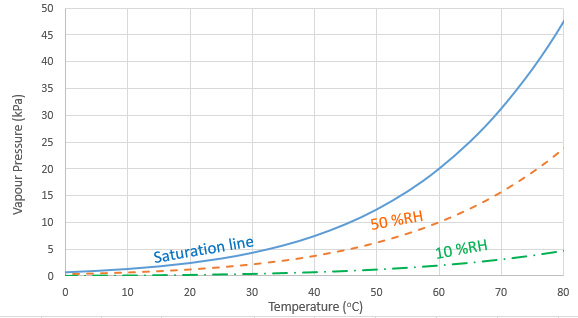 Figure 2. Saturation vapour pressure, 50 %RH and 10 %RH plots against different temperature (Assuming ideal gas behaviour).
3). Dew point temperature for relative humidity measurement
The condensation of water vapour is not only a good indicator to show the saturation of the vapour pressure, but also used to determine the relative humidity of the environment. As an example, in Figure 3, the red dot represents the unknown water vapour pressure of air which is below the saturation point ew(60 °C). By decreasing the air temperature gradually, the saturation vapour pressure of the air declines along the saturation line. If the total amount of water vapour is fixed, the water vapour pressure is a constant throughout the entire process. When the air temperature drops to td, the saturation vapour pressure ew(td) matches the existing water vapour pressure and the dew condensation occurs. The temperature at the condensation is known as dew point temperature td , which is equal to 45.8 °C in this example. Then, the relative humidity of air at 60 °C is calculated by the following equation with the assumption of ideal gas behaviour:
Relative Humidity = 
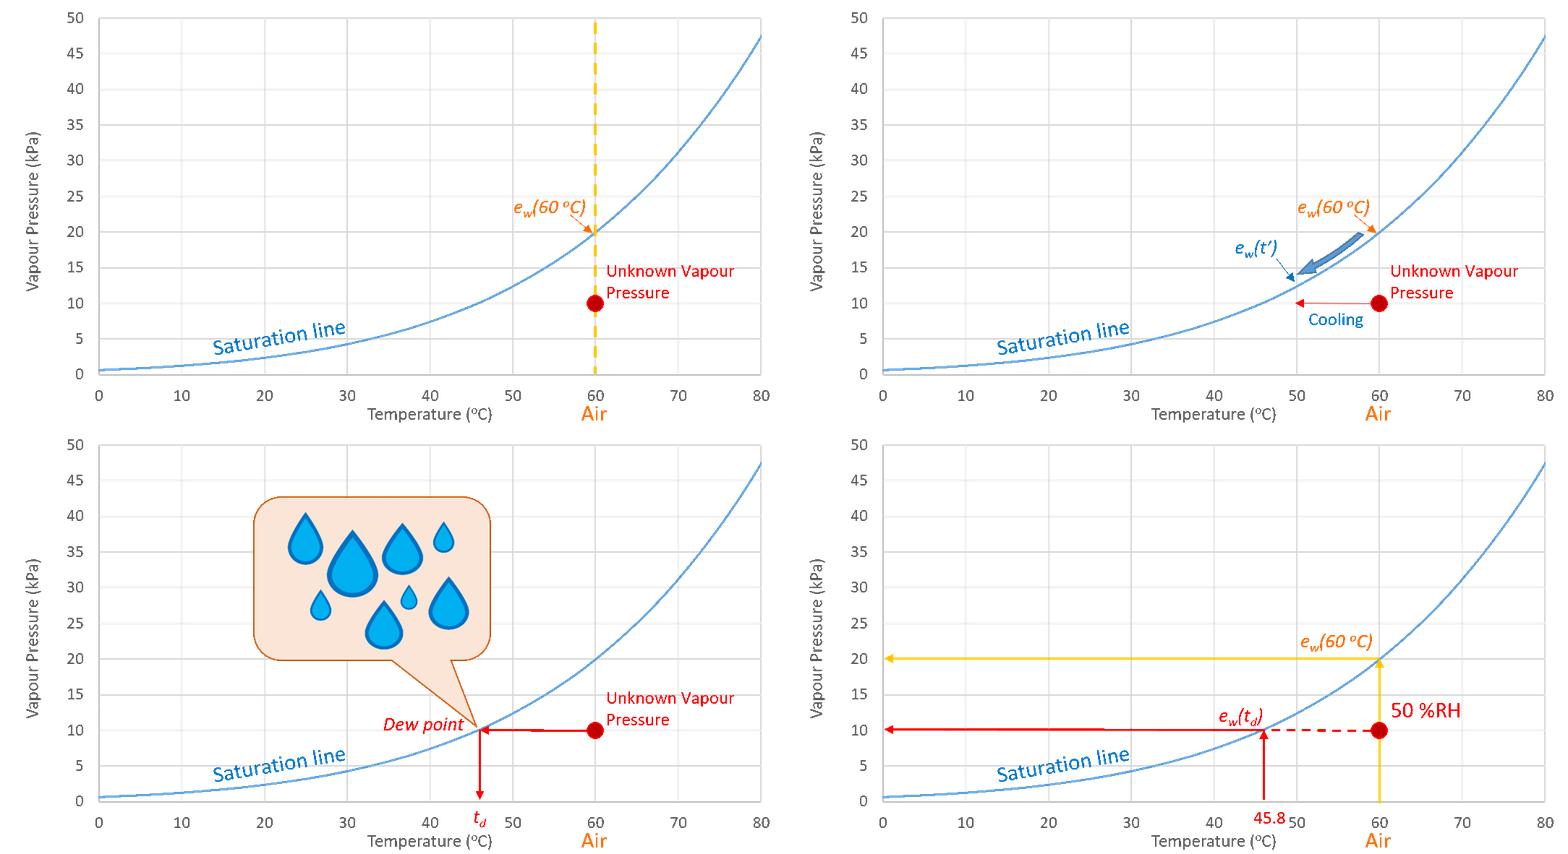 Figure 3. Dew-point temperature for relative humidity evaluation
4). Chilled-mirror dew point hygrometer
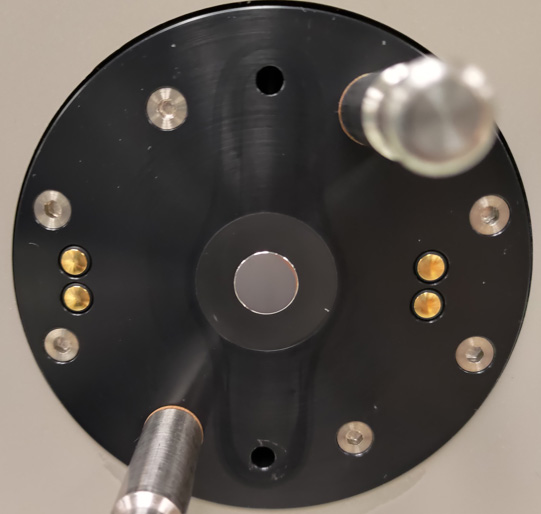
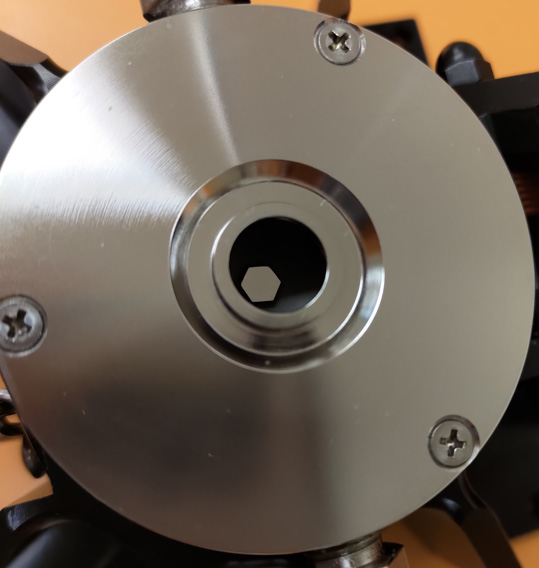
A chilled-mirror dew point hygrometer is an instrument which applies the condensation phenomenon to accurately measure the dew point temperature. The measurement uncertainty in dew-point temperature is normally less than 0.1 °C, which corresponds to an uncertainty of less than 0.6 %RH at room temperature. This instrument consists of a highly polished mirror as shown in Figure 4. The temperature of the mirror is precisely controlled by a stack of thermoelectric coolers and monitored by an embedded platinum resistance thermometer (PRT). An optical feedback system, which consists of a monochromatic light source and several monitoring photodetectors (PDs), is used to detect and stabilize the condensation. In Figure 5(a), PD1 monitors the specular reflection from the mirror and PD2 monitors the scattered light. When the temperature of the mirror is above the dew point temperature, incident light from the light source is reflected by the polished mirror to PD1 and PD2 receives no optical signal. When the mirror is cooled down to the dew point temperature, a layer of dew is condensed on the surface of the mirror as shown in Figure 5 (b). The incident light is scattered in all directions and causes a significant drop in the specular reflection. The condensation level of the water vapour can be detected by monitoring the reflected optical signal received by PD1 and the scattered optical signal received by PD2. The feedback system then finely adjusts the mirror temperature until an equilibrium stage of the condensation is reached i.e. the layer of dew will not grow or evaporate. Finally, the temperature measured by the PRT at the equilibrium stage is reported as the dew point temperature for the relative humidity calculation.
 (a)
(a)
 (b)
(b)
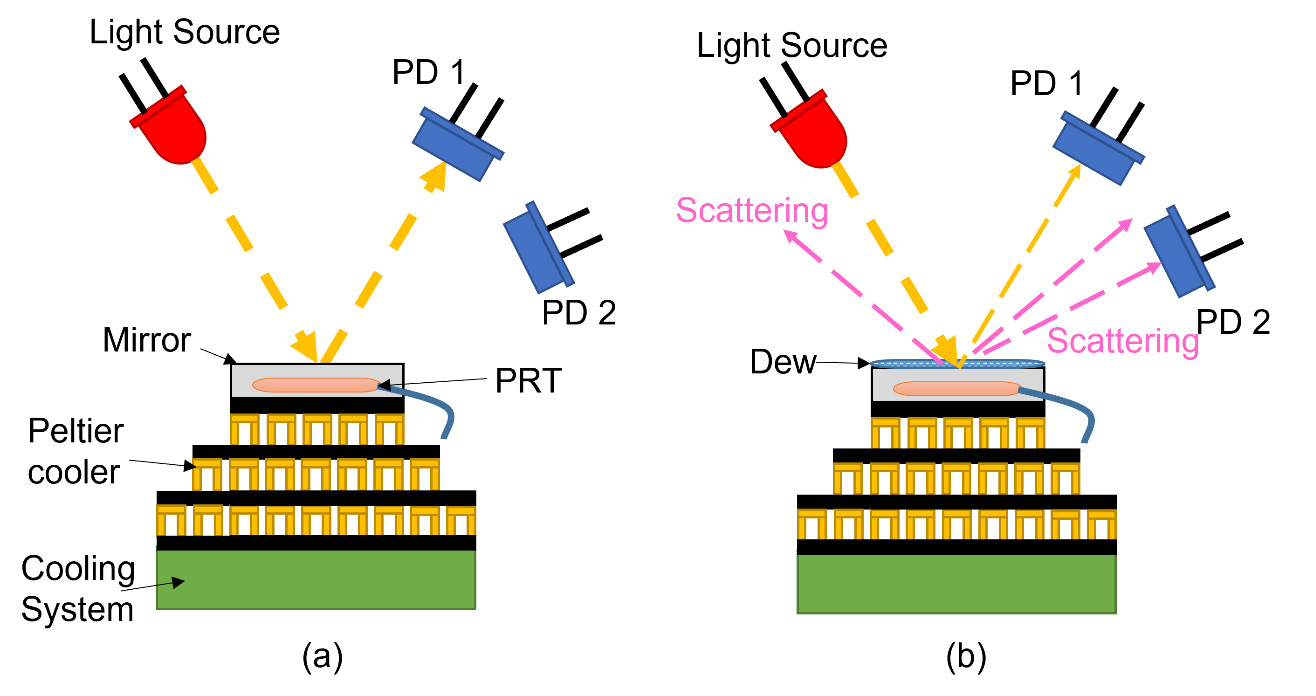 Figure 5. Typical structure of chilled mirror sensor for dew point temperature measurement. Temperature of the mirror is (a) above the dew point and (b) at the dew point temperature.
5). Other common relative humidity measurement instruments
There are many other types of relative humidity measurement instruments in the market. In this section, we discuss some commonly available instruments, such as the psychrometer, the electrical hygrometer and the mechanical hygrometer.
5.1. Psychrometer
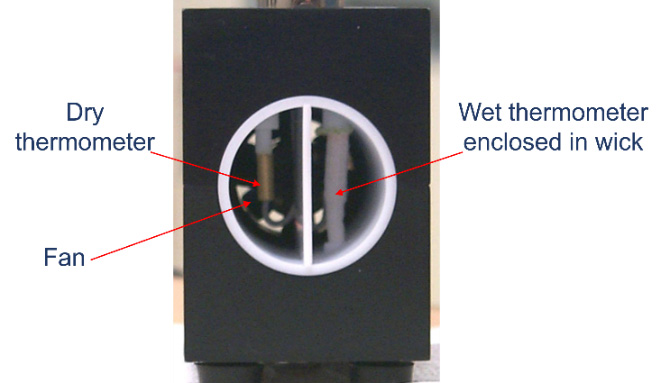
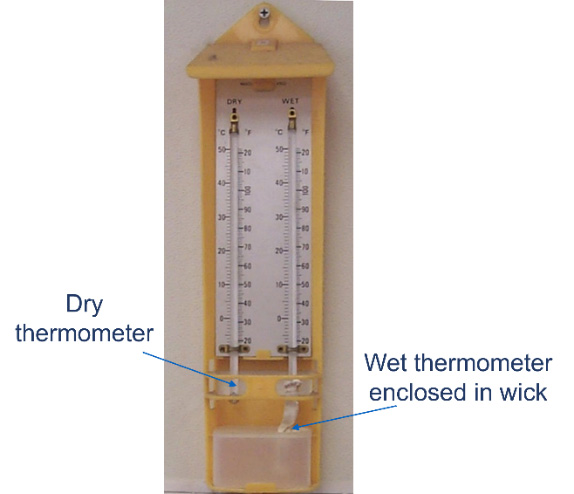
A psychrometer consists of two thermometers. One of the thermometers measures the air temperature (dry bulb) and another thermometer is enclosed in a wick (wet bulb) which is maintained wet by capillary effect from a water tank. The water in the wick evaporates at a rate related to the level of humidity of the environment, thus provides a cooling effect to the wet bulb. The vapour pressure of the air ew(td) is evaluated by the temperature difference between the dry bulb (tdry) and the wet bulb (twet) following the equation below:

where P is the atmospheric pressure and A is the psychrometer coefficient with typical value of 0.00067. The psychrometer can be classified as aspirated psychrometer and non-aspirated psychrometer. The aspirated psychrometer consists of a ventilating fan to provide constant air flow for more accurate measurement. Figure 6 shows the photos of these two types of psychrometers. The measurement uncertainty of the psychrometer is normally around 2 %RH to 5 %RH.
5.2. Electrical hygrometer
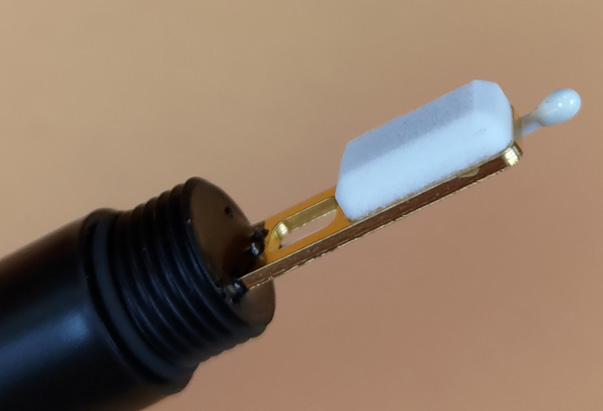
An electrical hygrometer consists of a resistive or capacitive sensor made of hygroscopic material between two electrodes. The resistance or capacitance of the hygroscopic material changes with the amount of absorbed moisture. The hygroscopic material of the resistive hygrometer can be a liquid electrolyte held between two glass rods, and the hygroscopic material of the capacitive hygrometer can be a thin film polymer. The sensors are normally encapsulated to prevent dust and contamination. Photos of the sensors are shown in Figure 7. The measurement uncertainty of electrical hygrometer is normally around 2 %RH to 3 %RH. It should be noted that the difference in moisture absorption rate between ascending and descending humidity condition could be more significant in the dielectric materials. The difference may lead to hysteresis error in the results when different measurement sequence is applied.
 (a) Electrolytic-resistive sensor with encapsulation
 (b) Capacitive sensor IC
5.3. Mechanical hygrometer
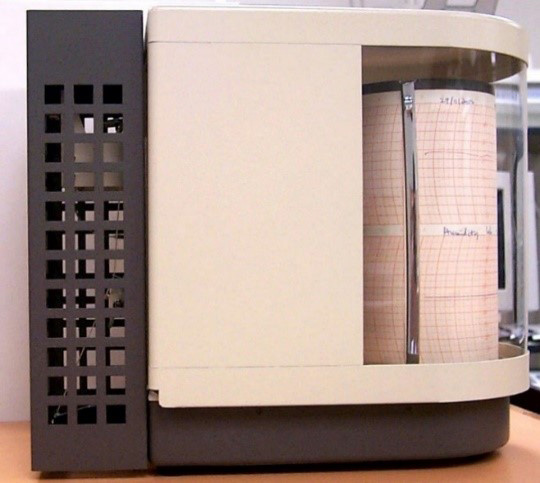
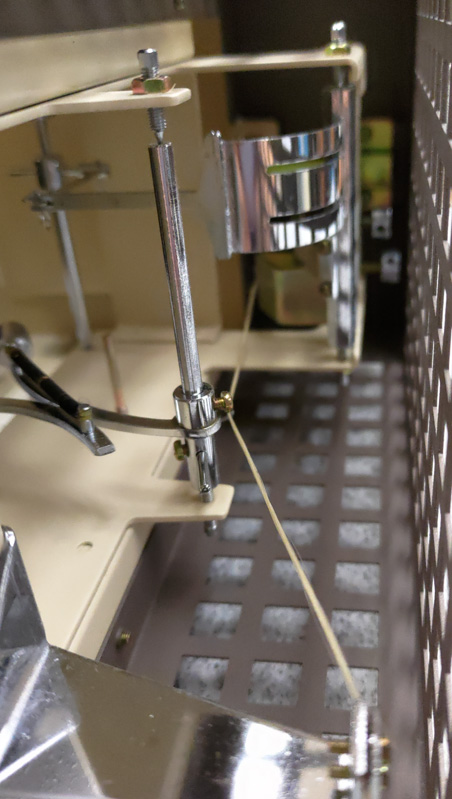
Mechanical hygrometer is the earliest type of hygrometer which measures the level of expansion and contraction of material under different humidity conditions. The sensing materials is a human hair, cow’s intestine, textile or plastic. The dimensional change of the material is amplified by mechanical devices such as levers to a pointer that moves over a recording chart as shown in Figure 8. The measurement uncertainty of the mechanical hygrometer is around 5 %RH to 15 %RH. It is normally used in room temperature. The response time of a mechanical hygrometer is slow. The hysteresis error problem is more pronounced for this type of hygrometer.
 (a) Mechanical hygrometer
 (b) Sensing element
Reference:
- BS 1339-3:2004 Humidity. Part 3 - Guide to the measurement of humidity
- Handbook of temperature measurement, Robin E. Bentley
Vibration
What Makes Our Phones So Smart in Motion Detection?

Andrew CH Au, Brenda HS Lam
Acoustics, Ultrasound & Vibration Laboratory
Standards and Calibration Laboratory
The smartphones we use today are sophisticated devices that are equipped with many different sensors such as accelerometer, gyroscope, magnetometer, illuminance meter and touchscreen to accomplish many coolest feats in engineering. These tiny machines can track our movements, monitor our heart beats, and anticipate our needs. Among these sensors, accelerometer and gyroscope are two of the most widely used types of sensors in smartphones.
Accelerometer is used to detect the orientation of a phone, this provides a comfortable viewing experience to the user by changing the orientation of the display from portrait to landscape and vice-versa based on the orientation of the phone. For example, the best way to watch YouTube videos on mobile phone is to hold the phone horizontally so the user can view the videos in landscape. The video takes up the entire screen, so the image is clearer and larger. Besides, accelerometers can be used as a pedometer to count steps taken by a user. Many different health & fitness applications and sports apps analyze the counted steps to determine the frequency, intensity, duration and patterns of the movement. This can help estimate calories burnt during exercise as well as motivate the users to keep track of their exercise routines and meet their goals. Moreover, some higher-end phones would employ the use of motion-based gesture recognition algorithms on triaxial accelerometer outputs to improve the user experience on mobile apps and gaming.
Since an accelerometer measures linear acceleration only, it measures the directional motion of a device but is not able to resolve its laterally tilted position during that movement unless a gyroscope or gyro sensor is there. Gyroscope is another orientation sensor in smartphones which measures angular rotational velocity. Usually, it adds an additional dimension to the information supplied by the accelerometer to determine the orientation and motion of the phone more accurately. Popular apps like Google Sky Map and Pokemon Go use gyroscope data to improve measurement accuracy.
Nowadays, the state-of-the-art 9-axis devices combine a 3-axis gyroscope, 3-axis accelerometer and 3-axis compass in the same chip together with an onboard digital motion processor capable of implementing different complex motion algorithms.
 Figure 1 STMicroelectronics LIS331DLH accelerometer and the L3G4200D gyroscope in Iphone 4
What is the structure of an accelerometer?
Accelerometers are often designed to sense a small amount of motion with an electronic circuit by using electrical, piezoelectric, piezoresistive or capacitive effects. Modern accelerometers in smartphones are micro electro mechanical system (MEMS) accelerometers. They are fabricated on silicon using microelectronic fabrication techniques which make their sizes microscopic. MEMS accelerometer has a tiny seismic mass attached to a spring system which is confined to move along one direction between fixed metal plates. When an acceleration in that particular direction is applied, the mass will move and the capacitance between the mass and the plates will change correspondingly. This change in capacitance is proportional to the acceleration level and is measured for determining the motion of the device.
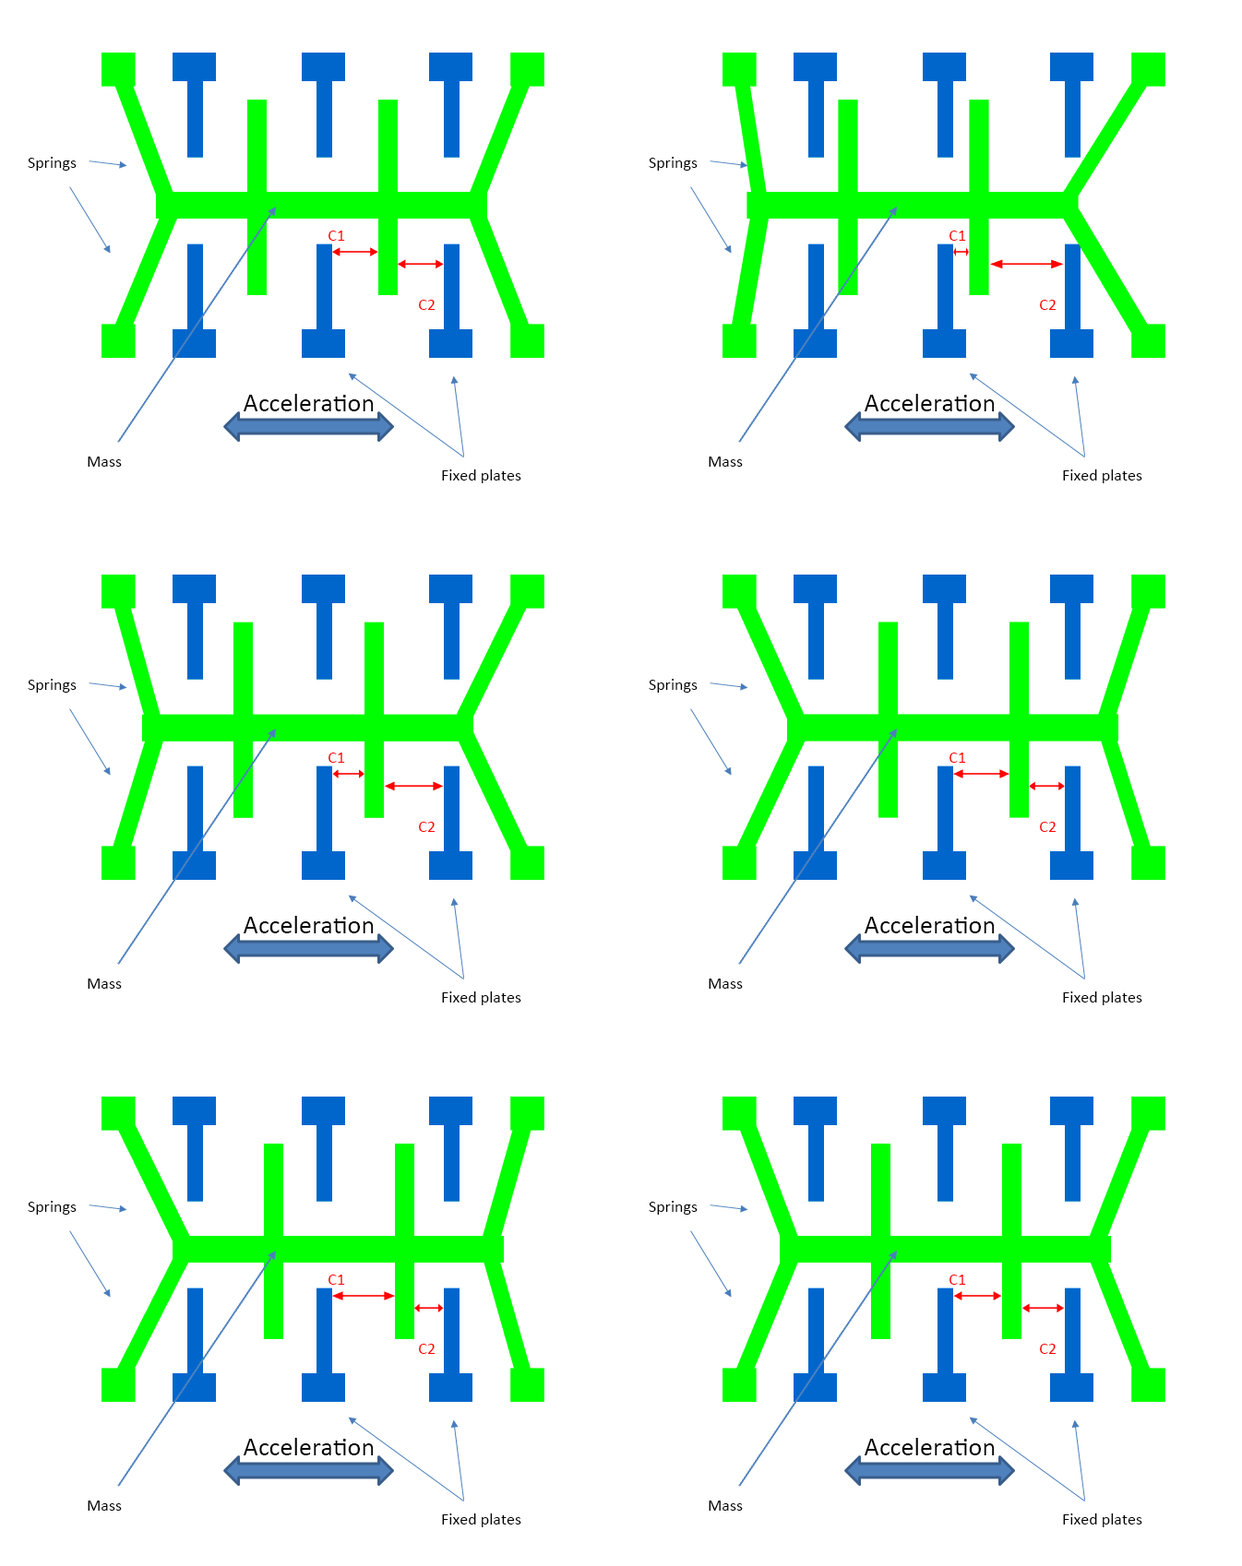 Figure 2 The seismic mass circuit in MEMS accelerometer
What is the structure of a gyroscope?
Gyroscope or gyro sensor is a device, which is designed based on conservation of angular momentum, measures or maintains orientation and angular velocity. A traditional gyroscope consists of a rotor such as spinning wheel or disc, and an outer frame. The rotor will maintain the direction of its spinning axis regardless of the orientation of the outer frame.
 Figure 3 A traditional gyroscope (Open source from Wikipedia)
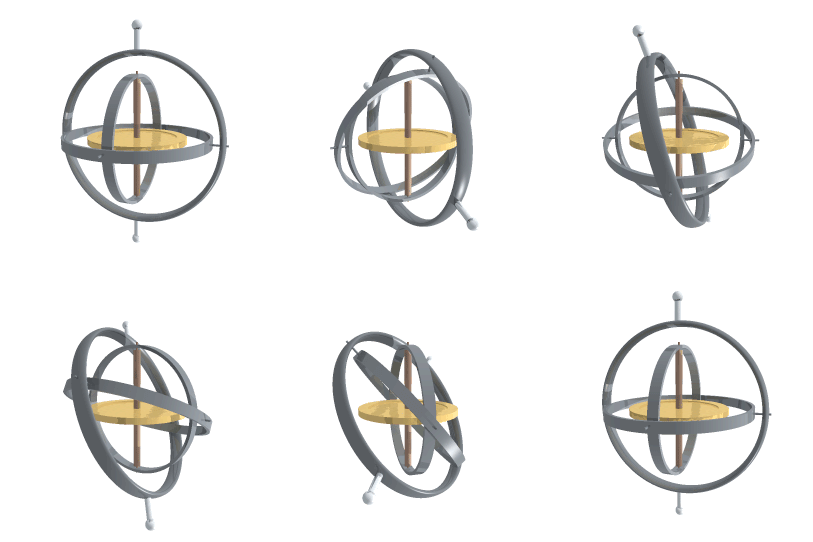 Figure 4 Animation of a traditional gyroscope (Open source from Wikipedia)
MEMS gyroscope in smartphones, however, is designed based on another operating principle known as Coriolis effect. This effect can be explained in the picture below: A person standing near the center on a rotating platform moves towards a point near the outer edge, his tangential speed relative to the ground will be increased as indicated by the length of the arrows. This rate of change of the tangential speed caused by the radial velocity is known as the Coriolis acceleration. By measuring this acceleration, the angular velocity can be determined.
 Figure 5 Conceptual idea of Coriolis effect
Similarly, when a mass is moving in a particular direction at a particular speed, an external angular rate applied will cause a perpendicular displacement of the mass due to Coriolis effect. Similar to the MEMS accelerometer, the displacement will cause a change in capacitance which will be measured to determine the corresponding angular velocity.
 Figure 6 Motion vectors of Coriolis effect
Calibration of Accelerometers
Comparison Method
Piezoelectric accelerometers are usually calibrated by means of the comparison method (Back-to-back Method) as stipulated in ISO 16063-21. The basic principle of this method is to mount the sensor under test on the reference accelerometer and expose them simultaneously to the same acceleration. The sensitivity of the sensor under test is obtained from the ratio of their electrical output signals and the sensitivity value of the reference accelerometer. This method is simple and widely used in routine calibration or performance check purposes.
Primary Method
Reference standards or those require the highest measurement accuracy must be calibrated by the primary methods. ISO 16063-11 describes various methods for the primary calibration of accelerometers.
Method 1 (Fringe-counting Method) is applicable to sensitivity magnitude calibration in the frequency range of 1 Hz to 800 Hz. Method 2 (Minimum-point Method) can be used for sensitivity magnitude calibration in the frequency range of 800 Hz to 10 kHz. Method 3 (Sine-approximation Method, SAM) can be used for both magnitude and phase sensitivity calibration in the frequency range of 1 Hz to 10 kHz. Due to its benefits of wide frequency and amplitude ranges and its ability to measure both amplitude and phase shift of vibration signals, Method 3 is widely used in primary calibration of accelerometers.
The Standards and Calibration Laboratory’s Primary Vibration Measuring System
The pictures below show the major instruments of the Laboratory’s vibration measuring system. The system employs an electrodynamic vibration exciter to generate motion quantities. The accelerometer under calibration is mounted on the top of the vibration exciter; a laser vibrometer is mounted on the top of a vibration-isolating foundation with the laser beam pointed on the positions surrounding the accelerometer. The system is based on the principle of laser interferometry using red helium-neon laser with wavelength of 633 nm. The quadrature output signals of the interferometer together with the filtered and amplified electrical signal of the piezoelectric accelerometer are sampled simultaneously by a digital oscilloscope. The digital data are then processed by the software utilizing SAM to calculate the complex sensitivity of the accelerometer.
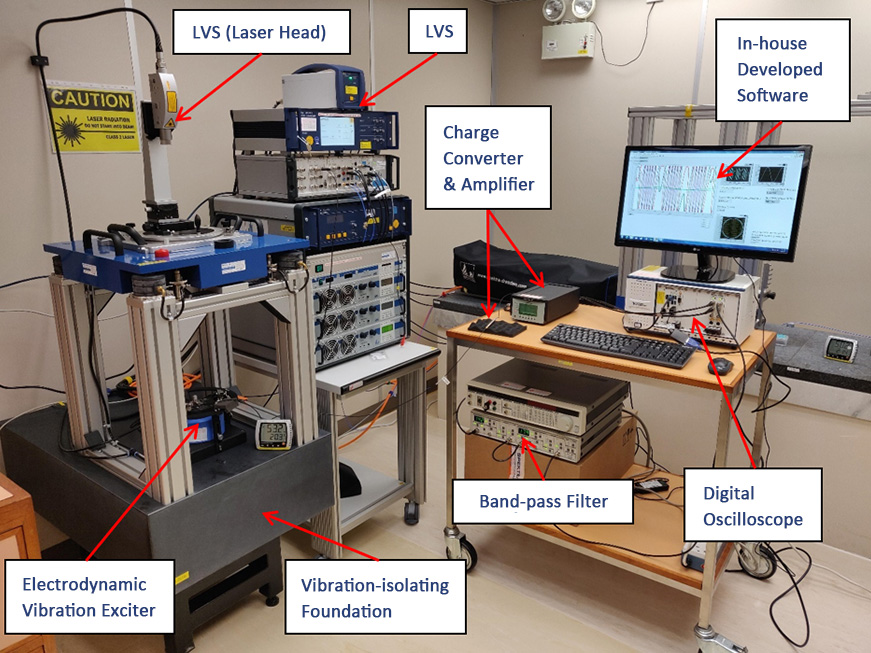 Figure 7 The Laboratory’s vibration measuring system
Operating Principle of Primary Vibration Calibration by Laser Interferometer
According to Method 3 of ISO 16063-11, optical interferometry can be used to trace back the mechanical displacement, velocity and acceleration to wavelength of the laser light. The optical schematic of a modified Michelson interferometer with homodyne type is shown in Figure 7. The laser is the stabilized red helium-neon type with wavelength of 633 nm.
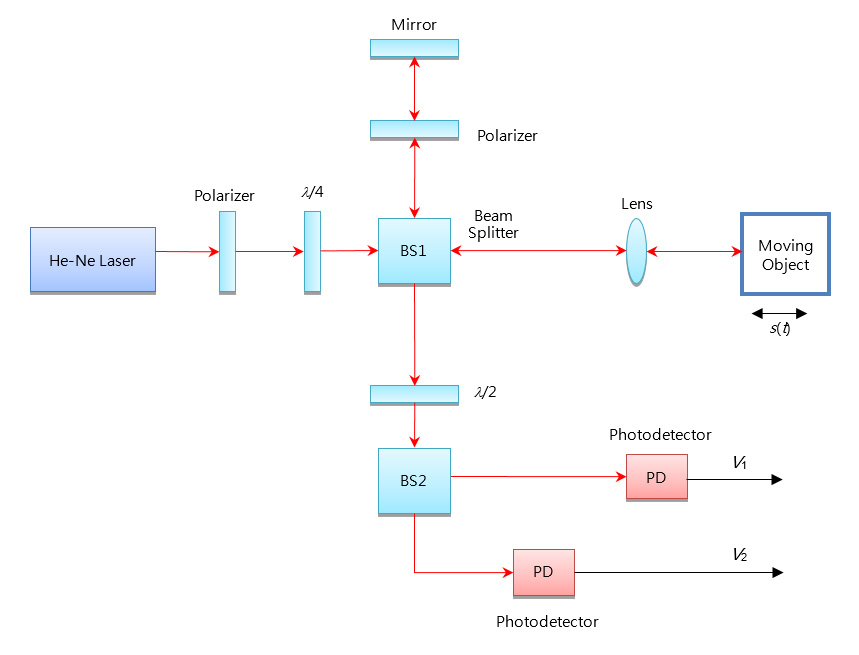 Figure 8 Schematic of modified Michelson interferometer
The polarized laser beam is passed through a λ/4 etarder plate and becomes circularly polarized. A non-polarizing beam splitter BS1 splits the incident beam into two orthogonal beams with equal intensity. The reference beam is polarized and directed onto a fixed mirror. The circularly polarized measurement beam reflected from the surface of a moving object returns to BS1. The reference and measurement beams pass through a λ/2 retarder plate which can be adjusted to produce optical interference at a polarizing beam splitter BS2 such that two beams corresponding to the in phase (I) and quadrature (Q) components respectively are obtained. Using the calculation method described in the next section, the position of the moving object can be obtained. Adding the sample time information, we can calculate the velocity and acceleration of the moving object.
 Figure 9 The output voltage of the photodetector (V1)and(V2)
The Mathematics of the Sine-approximation Method
This section is suitable for readers who are interested in mathematics.
The output voltages from photo detectors (PD) V1 and V2 vary with the modulation phase difference ϕmod between the two beams according to the following equation after removing dc components.
 (1)
(1)
 (2)
(2)
The laser beam in the measurement arm is scattered back from the moving object, the optical path difference between the two beams, L(t), is a function of time. Let s(t) be the displacement of the moving object, ∅s be the initial displacement phase.
 (3)
(3)
The outputs of photo detectors and accelerometer are synchronously sampled. The SAM as defined in ISO 16063-11 is used to perform numerical arctangent demodulation. Assuming  and apply a phase unwrapping routine to avoid the discontinuities due to the ambiguity of arctangent function.
 (4)
(4)
 (5)
(5)
 (6)
(6)
 (7)
(7)
A series of n measurement results for different modulation displacement values are collected. The three unknown parameters, A, B and C are estimated by solving n equations using the least squares sum method.
Expressed in matrix form,
 (8)
(8)
 (9)
(9)
Let the error vector be ϵ
 (10)
(10)
The square error, ϵϵT
 (11)
(11)
To minimize the square error, set the derivative of expectation with respect to β to zero,  .
.
 (12)
(12)
 (13)
(13)
 (14)
(14)
β is the best estimate for  . The modulation displacement amplitude
 (15)
(15)
The initial displacement phase
 (16)
(16)
Assume sinusoidal vibration frequency ƒ, the acceleration magnitude, a and initial acceleration phase ∅a
 (17)
(17)
 (18)
(18)
The series of simultaneously sampled accelerometer output values, u(ti) are also processed by SAM to estimate the values of Au, Bu and Cu.
 (19)
(19)
 (20)
(20)
The accelerometer output amplitude
 (21)
(21)
The initial accelerometer output phase
 (22)
(22)
The modulus of complex sensitivity Sa and phase shift Δ∅ of the accelerometer
 (23)
(23)
 (24)
(24)
Figure 10 shows the data at different stages of the calculation.
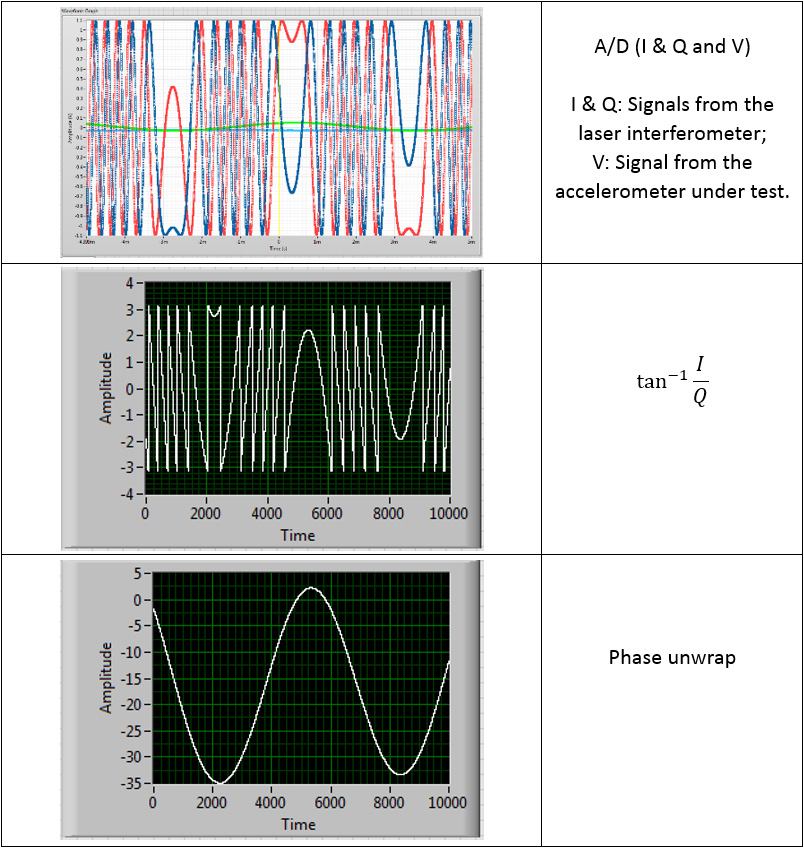 Figure 10 The data at different stage of the calculation
Reference:
[1] ISO 16063-11:1999, “Methods for the calibration of vibration and shock transducers - Part 11: Primary vibration calibration by laser interferometry”
[2] ISO 16063-41:2011 “Methods for the calibration of vibration and shock transducers Part 41: Calibration of laser vibrometers”
[3] Primary vibration calibration with CS18P using laser vibrometer technology Holger Nicklich, Ume Buehn, SPEKTRA GmbH Dresden, Germany
[4] Realization and Results of a DKD Interlaboratory Comparison Regarding the Measurand Acceleration Dr. Thomas Bruns, Philipp Begoff, Michael Mende XX IMEKO World Congress Metrology for Green Growth September 9-14, 2012, Busan, Republic of Korea
[5] https://www.memsjournal.com/2010/12/motion-sensing-in-the-iphone-4-mems-accelerometer.html
[6] https://www.polytec.com/us/vibrometry/technology/
[7] HowToMechatronics.com